Eight indicators of global knowledge and response to COVID-19 pandemic are analysed in this study aimed at contributing to clarity about the current dynamics of information and decision making which lack evidence based and comparative logic, and levels of injustice that the pandemic has revealed or even accentuated

By Juan Garay
Professor of Bioethics, Chiapas University, Mexico
COVID-19 IN THE CONTEXT OF GLOBAL HEALTH EQUITY
Indicators of the Objective Analysis of the Pandemic and Decision-Making
Any cause of loss of health (risk factor or disease) is measured in relation to others by incidence (cases/population), fatality (deaths/cases), “burden of disease” (healthy life years lost by that cause, in the population) and distribution by geographical and population variables.
Any public health intervention (prevention, treatment and rehabilitation) is decided in relation to others (given the resources always limited) according to risk/benefit (harm vs. good), cost-utility ( cost of intervention in relation to the prevention or recovery of healthy life years that would be lost without such action) and opportunity-cost ( relation to the impact of other potential interventions with the same level of resources).
The distribution of a health problem, including the effect of decided interventions, is measured by unfair or preventable inequalities (inequity) through the “burden of health inequity” (excess deaths or loss of healthy life years in relation to feasible and sustainable levels of health for all).
These eight parameters for understanding a health problem are uncertain in the global knowledge and response to the COVID-19 pandemic and reveal dynamics of information and decision making which lack evidence based and comparative logic, and levels of injustice that the pandemic has revealed or even accentuated.
Analysis of the Magnitude (and Distribution) of the Pandemic
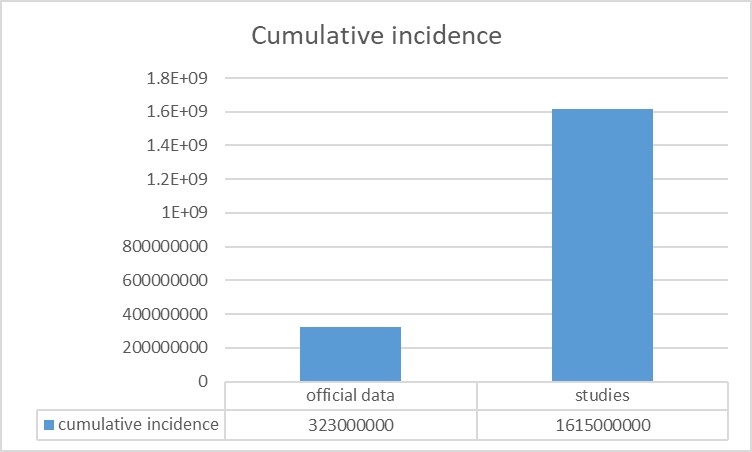
- Incidence: Diseases causing acute infections such as COVID-19 are better measured by regular seroprevalence studies which allow the estimate of the cumulative proportion of people which have been already infected (with presence of IgG antibodies). During 2020, the pandemic without vaccination, these studies would have made it possible to ascertain the real incidence of the disease. In contrast, the reporting systems varied between countries as they screened either symptomatic cases, serious cases or primary or secondary contacts. Those daily reports of “new infections”, largely biased and non-comparable between countries have received the focus of the media and the attention of societies around the world. Even in the same country, the case detection system varied, so the comparison between pandemic waves is also biased. In the few[i] (and very poorly disseminated and discussed) seroprevalence studies conducted, the real incidence of the pandemic could be estimated to be between 2 and up to 10 times higher[ii] than the officially reported one. Although the official WHO consolidated data show a cumulative incidence of 323 million cases, applying the ratio of seroprevalence studies/reported cases in the populations thus studied and on a weighted basis (according to population sizes), the real cumulative incidence may be of more than 1,600 million, as shown in Figure 1. The distribution of the incidence rate in the population is uncertain due to the lack of population studies, but it seemed to have been affecting more young people as the pandemic evolved.
Figure 1: Incidence of COVID-19 data and estimation by seroprevalence studies
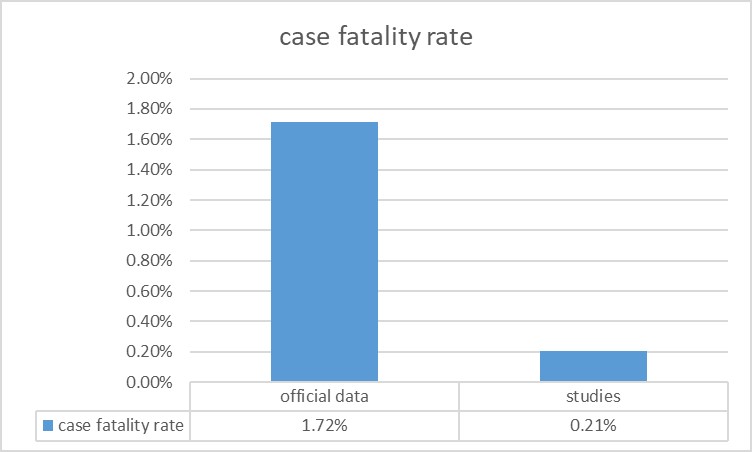
- Case-Fatality: In addition to the underestimation of the cases described above (denominator of case fatality), the number of deaths by COVID-19 has been very possibly also biased, in many cases overestimated[iii]. After two years of pandemic, the question of either death with COVID-19 or death by COVID-19 arises. Following infection or vaccination it seems the virus genome can, by reverse transcriptase, integrate into the human genome and express mRNA (PCR positive) and Receptor Binding Protein (positive antigen test) without the presence of active viruses[iv]. On the other hand, even in the presence of active infection (if demonstrated by viral culture), the virus may be asymptomatic or only cause mild (as shown in the seroprevalence studies described above) symptoms and not be the main or direct cause of severity or death. Most of the deaths attributed to COVID-19 have been in the elderly and with base pathologies (more than 90 %) many of them potentially also lethal. As the pandemic has been affecting a larger cumulative proportion of the population and many other clinical symptoms and tables have been attributed to the virus than the initial most specific bilateral pneumonia, the presence of antigen or PCR and therefore the attribution to the virus as the main or single cause of death, has been possibly overestimated. The target figure could only be known by autopsy series, which has hardly been done during the pandemic. In the few unpublished autopsy series, 40 %[v] and even up to 80 % of the deaths attributed by COVID-19 were actually due to other causes, in particular the complications of hypertension, obesity and diabetes and undiagnosed cancers. On the other side, there may be countries where there is an under-reporting of mortality in general and of mortality certificates with accurate diagnosis of cause of deaths. As regards the assumptions that there is an underestimation of COVID-19 deaths in relation to the excess morality observed by the pandemic in the most affected countries, it would have to be ascertained whether this excess mortality is in fact mainly due to lockdown measures and their multiple health effects, as mentioned below. Taking into account the previously estimated incidence according to population seroprevalence studies and the mortality adjusted to the proportion of deaths directly caused by COVID-19 among those attributed to it, the case fatality would be 0.33 %, very similar to seasonal flu. The distribution of the case fatality rate in the population is, in any case, very uneven, showing variations from less than 1 per 1,000 cases for children under 30 to more than 20 % for those over 80 years of age. Case fatality of the disease has been decreasing, due to a growing share of infections in the youth, the effects of the pathogenicity of evolving variants, the effects of natural and induced immunity and the effectiveness of treatments.
Figure 2: Fatality calculated by official data and estimated by the adjustment of COVID-19 mortality and the highest estimated incidence level
- Burden of disease: The loss of life years is measured in each disease by the difference between the age of death for the cause studied, in this case the COVID-19 infection, and the average life expectancy in a given population[vi]. The highest national average life expectancy has been used for global comparative studies, which for more than two decades has been that of Japan (questionable reference as below argued in the equity analysis). This burden of disease due to premature death, has hardly been studied, published or disseminated. The average age of death has been (according to studies in the United States) 71.63 years hence on average each death by COVID-19 has caused the loss of 12.73 life years in relation to the mentioned reference. As the average number of deaths per year has been around 2.56 million in 2020-2021, the pandemic has caused the loss of around 32.58 million life years due to premature death, i.e. 0.0041 life years per person and year (day and a half per person and year). This burden of disease is higher in the countries with the highest death rate per COVID-19. Peru, with the highest rate – 6,200 deaths per million inhabitants- would have a burden of disease of around annual 0.0124 life years per person (about 4.5 days per person per year). The burden of disease also varies according to age, with some100 times less in those under 60 (90 % of the world’s population and less than 10 % of COVID-19 deaths). While the long-term impact on disability is still poorly known, its impact on the burden of disease may be counterbalanced by the very controversial lower weight of life years in old age and, in any case, the disability of a high proportion of COVID-19 deaths in patients with co-morbidity due to other causes and thus already a baseline degree of disability. Compared to the overall burden of disease (some 1,706 million life years due to premature death)[vii] COVID-19 caused on average 1.9 % of the overall burden of disease in the last two years. In relation to the most important causes of loss of life years due to premature death, the following list shows the proportion that COVID-19 accounts for each of the causes, according to the diagnostics with COVID-19 and the estimated direct deaths by COVID-19 (60 % of the latter)[viii].
Table 1: Overall loss of life years due to pandemic related to other diseases
| Cause | YLLs (000s) | COVID-19 as% of top channels | Estimated 60 % due to COVID-19 |
| All Causes | 1706631 | 1.91 % | 1.14 % |
| Neonatal conditions | 183207 | 17.79 % | 10.68 % |
| Ischaemic heart disease | 175605 | 18.56 % | 11.13 % |
| Stroke | 122115 | 26.69 % | 16.01 % |
| Lower respiratory infections | 105006 | 31.03 % | 18.62 % |
| Diarrhoeal diseases | 68394 | 47.65 % | 28.59 % |
| Road injury | 62279 | 52.33 % | 31.40 % |
| Tuberculosis | 61751 | 52.77 % | 31.67 % |
| Chronic obstructive Pulmonary dis. | 54573 | 59.71 % | 35.84 % |
| Congenital anomalies | 45199 | 72.10 % | 43.26 % |
| Cirrhosis of the liver | 42111 | 77.39 % | 46.43 % |
| Trachea, bronchus, lung cancers | 40849 | 79.78 % | 47.87 % |
| HIV/AIDS | 36131 | 90.19 % | 54.12 % |
| Diabetes mellitus: | 34171 | 95.37 % | 57.23 % |
| COVID-19 | 32588 | 100.00 % | 60.00 % |
| Kidney diseases | 32023 | 101.76 % | 61.07 % |
| Self-harm | 30937 | 105.34 % | 63.20 % |
| Malaria | 30855 | 105.62 % | 63.38 % |
| Interpersonal violence | 25699 | 126.80 % | 76.08 % |
| Colon and rectum cancers | 20570 | 158.42 % | 95.06 % |
| Hypertensive heart disease | 20482 | 159.10 % | 95.46 % |
| Stomach cancer | 19893 | 163.81 % | 98.30 % |
Compared to the loss of life years due to risk factors, the table below shows that the burden of COVID-19 disease is lower than that of 17 risk factors, even if all deaths with COVID-19 are attributed to COVID-19 deaths. It is striking and worrying to see that most of the risk factors that lose human life not only do not trigger, as COVID-19 has done, drastic measures of major investment or loss through lockdown. They neither attract research funds even close to those invested for COVID-19. In fact, for many of those risk factors, the private sector marketing invests large amounts to promote unhealthy life styles leading to sedentary, obesity, glucose intolerance and hypertension from processed foods high in sugar and salt, tobacco — including second-hand tobacco —, air pollution, interruption of breastfeeding and hyper-medication, among other causes related to the urban, competitive and consumer-style of life. Among the causes of highest loss of human life are also those related to global inequities such as malnutrition, lack of access to safe water and sanitation or the shortage of iron and vitamin A. The lockdown measures imposed to control the pandemic by COVID-19 may have significantly increased the loss of life years due to sedentary lifestyles. It remains to be seen whether the control measures have been responsible for less or more life years lost than the virus would have caused itself. Interestingly, as the main mechanism of severe disease and death in COVID-19 infections is the severe inflammatory response (“cytokines’ storm”) it remains to be seen whether the social response causing greater damage than the pandemic itself.
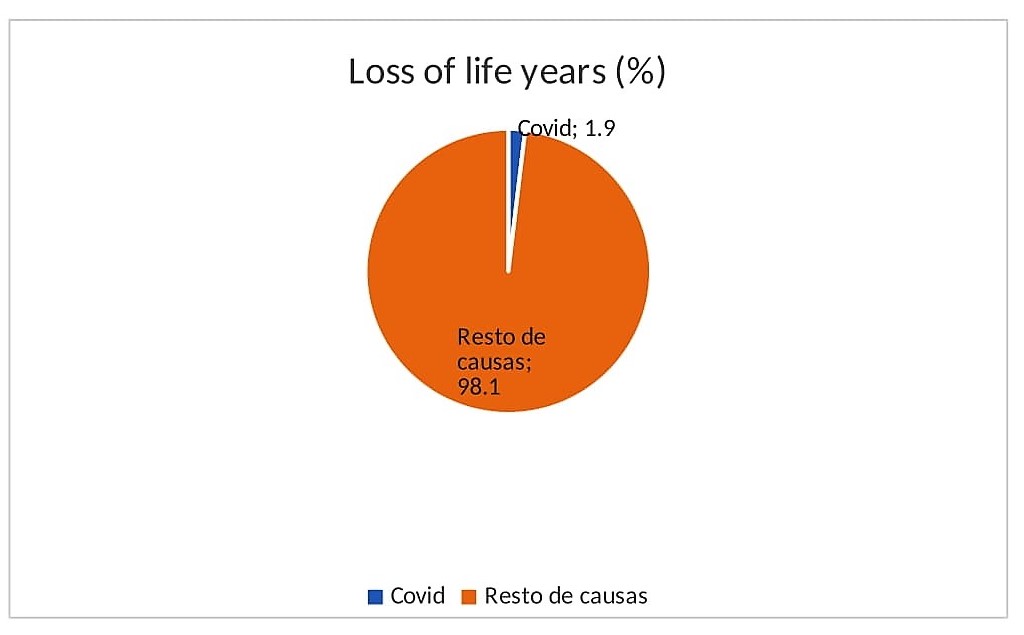
Table 2: Overall loss of life years due to pandemic for the main risk factors
| Cause | YLLs (000s) | COVID-19 as% of top channels | Estimated 60 % due to COVID-19 |
| High blood pressure — | 217963088 | 14.95 % | 8.97 % |
| Smoking — | 182478302 | 17.86 % | 10.71 % |
| High fasting plasma glucose — | 170573442 | 19.10 % | 11.46 % |
| High body-mass index — | 147694484 | 22.06 % | 13.25 % |
| Air pollution — | 147418240 | 22.11 % | 13.26 % |
| Child wasting — | 90994816 | 35.81 % | 21.50 % |
| Environment particulate matter pollution — | 83047567 | 39.24 % | 23.55 % |
| Diet high in sodium — | 70398895 | 46.29 % | 27.78 % |
| Diet low in fruits — | 64806281 | 50.29 % | 30.17 % |
| Unsafe water source — | 63892348 | 51.00 % | 30.60 % |
| Household air pollution from solid fuels — | 59472096 | 54.80 % | 32.88 % |
| Drug use — | 41658227 | 78.23 % | 46.94 % |
| Unsafe health — | 41474867 | 78.57 % | 47.15 % |
| Second hand smoke — | 36316502 | 89.73 % | 53.84 % |
| Diet low in vegetable— | 34210780 | 95.26 % | 57.15 % |
| Iron deficiency — | 33661690 | 96.81 % | 58.08 % |
| Vitamin A deficit — | 28992388 | 112.40 % | 67.44 % |
| LOW physical activity — | 23655862 | 137.76 % | 82.65 % |
| Child stunting — | 19406872 | 167.92 % | 100.76 % |
| Non-exclusive breastfeeding — | 14248898 | 228.71 % | 137.22 % |
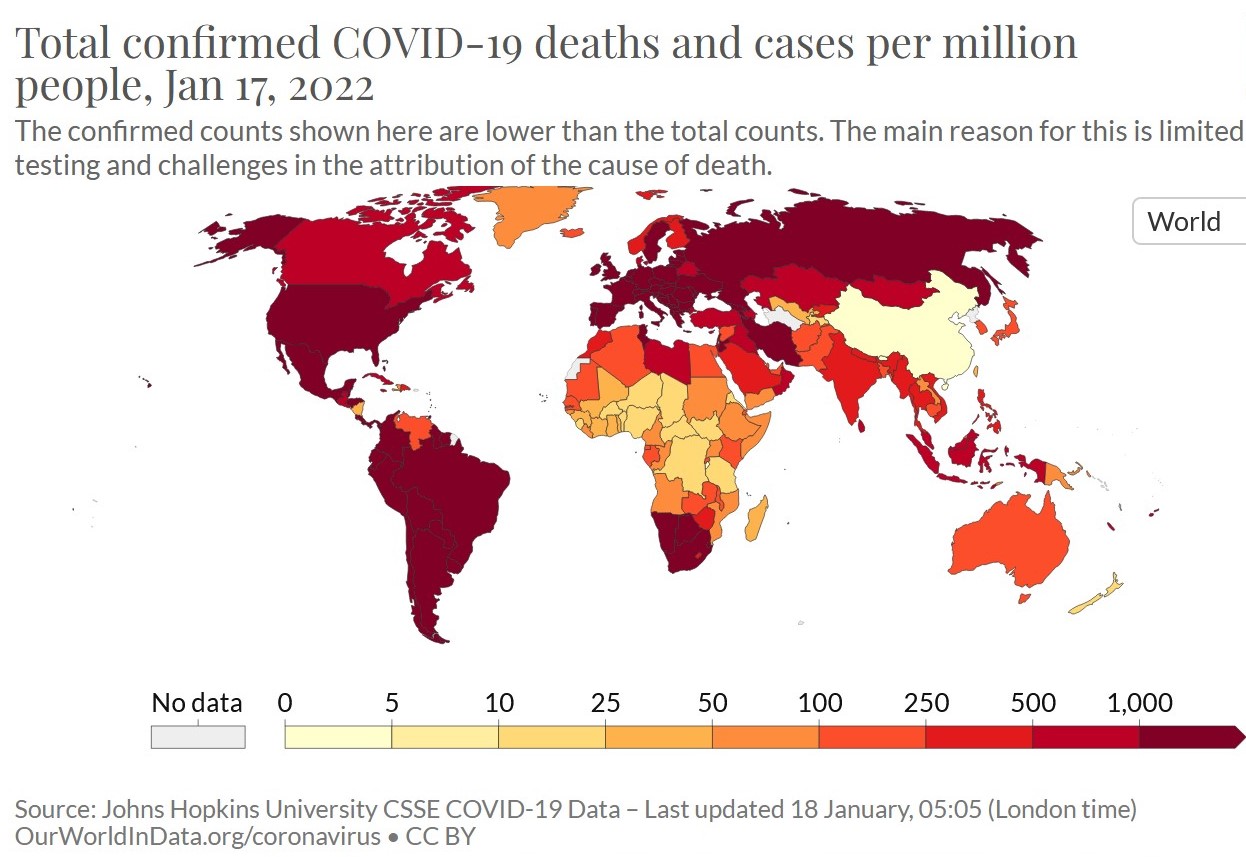
- Distribution – By age: Half of all deaths have occurred in patients aged over 85, above the highest national average of life expectancy (Japan, 84.36), two-thirds in patients aged over 80 (above the average of high-income countries), 80 % in patients aged over 72 (above the international average of life expectancy) and 95 % in patients aged over 60 years[ix]. By country: The following map shows the distribution of deaths per million by national averages.
Cumulative mortality rate per Covid per national average [x]
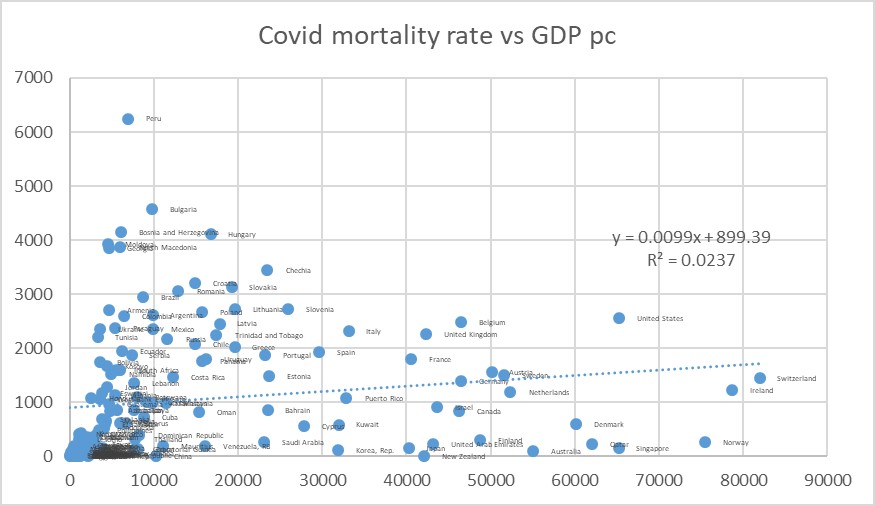
As shown in the graph below, the cumulative mortality rate for COVID-19 is unrelated to the GDP per capita (r2 = 0.023).
Figure 3: Cumulative mortality 2020-2021 per million per COVID-19 vs GDP bc, by country
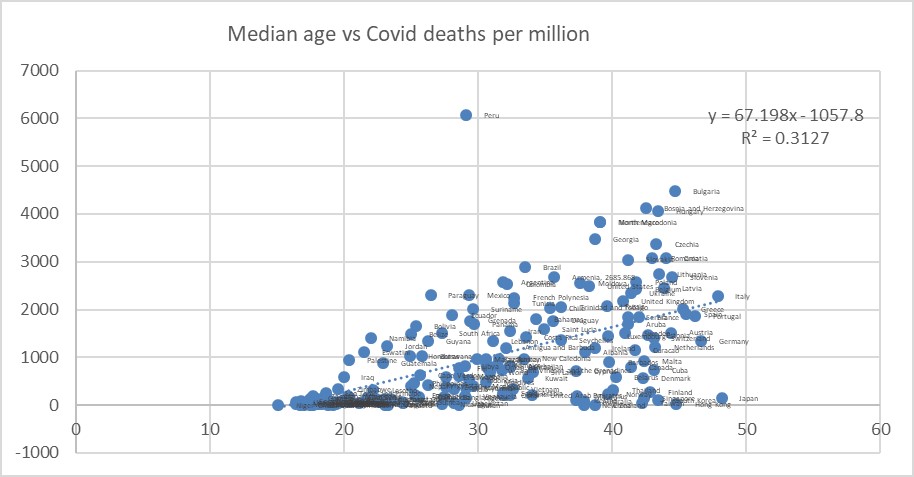
The clearest link we have found between the distribution of the mortality rate by country is the median age, which would explain, as the following graph shows, one third of the international variability.
Figure 4: Cumulative mortality 2020-2021 per million per COVID-19 vs median age, by country
The following table summarises the above indicators of magnitude of the pandemic by official data (reported by countries and WHO) and the estimates by population studies and in-depth analysis of cases described above:
Table 3: Measures of the magnitude of the COVID19 pandemic: official vs estimate data
| cumulative impact | annual mortality | Fatality3 | Annual Sickness Load (FMC)4 | |
| official data | 323000000 | 2770000 | 1.72 % | |
| estimates | 16150000001 | 16620002 | 0.33 % | 33240000
(1.1-1.9 % of the total) |
1: Estimates by multiplying the reported incidence rate by the weighted average incidence ratio of population seroprevalence studies/official case reports.

2: The average annual mortality attributed to COVID-19 is multiplied by the proportion of deaths seen in autopsy series as directly caused by COVID-19 (60 %)

3: This is the ratio between deaths and incidence.

4: Here only estimated for life yearslost as a result of premature death: Number of deaths due to the difference between the maximum life expectancy and the average death age during the pandemic.
Analysis of the Anti-Pandemic Measures
- Risk-benefit: Prevention and treatment measures against COVID-19 have mainly been lockdowns on mobility and contact in the population, vaccination and treatment. There are significant uncertainties in the level of positive impact of each of these measures disaggregated by age and health conditions, and even more in their negative impact. To study the impact of a public health measure, a population group (cohort) is monitored over time or compared between a population in which (case) the measure is applied and a population with similar demographic and epidemiological characteristics without such intervention (control). As regards lockdown measures, in most cases, they were taken on a generalised basis, independent of the social and household composition by age, health baseline situation and incidence and case fatality in each group (not well known or published, as described above), so it is not easy to analyse the disaggregated positive impact by population groups. On the other hand, the evolution of natural or induced immunity (since 2021) and the pathogenicity of evolving variants of the virus makes it difficult to estimate by cohorts the impact of each preventive measure. When comparing two populations, in general countries, with different prevention policies (as within one country it is considered unethical to expose part of the population to supposedly preventable risks), we find the bias of different demographic, socio-economic and epidemiological situations, and even of the information systems themselves. For example, the evolution of incidence and mortality following the lockdown measures between countries in Europe (with high lockdowns) and Africa (with low lockdowns or means to do so) does not indicate a benefit in lockdown measures, while the comparison between China and the United States or Europe indicates the opposite. As regards the comparison of incidence and mortality risks among persons using or not using different types of masks, there is not enough study and relative risk statistically significant to claim that their individual use protects against infection or reduces mortality, especially in open and ventilated spaces[xi]. As regards the adverse effects of these measures, it can be estimated that global lockdowns accounted for at least 3.363 % of economic contraction. Such economic loss has been highly uneven (see the inequity analysis below), increasing by possibly up to 10 % the burden of health inequity, some 1.6 million deaths per year and some 56 million life years lost, higher than the COVID-19 direct burden of disease. Another risk of lockdown measures lacking enough analysis is the impact of sedentarism[xii] and social isolation on the state of health, especially of older people and youth, with an increase in chronic disease morbidity in the elder and anxiety, depression and suicide rates, particularly among young people[xiii]. The risk/benefit of the lockdown measures should therefore be weighed at individual level according to age and risk factors, and at the population level according to the disaggregated impact and the direct and indirect negative health effects. In terms of vaccination, efficacy studies have been carried out in cohorts (phase III clinical trials by pharmaceutical corporations) which rendered national and WHO pre-qualification through clinical, laboratory and production practice evaluation. The WHO prequalified vaccines demonstrated a reduction in mortality of more than 90 % in vaccines based on mRNA channelled through nano-particles (Pfizer, Moderna) or viral vectors (Astra Zeneca and Jansen -DNA in this case-) and 60-80 % in attenuated virus-based vaccines (Sinopharm, Sinovac)[xiv]. Only one protein/based vaccine, Novavax, has been WHO pre-qualified but its coverage is still minimal. Other vaccines awaiting approval by the WHO, such as the Cuban and Corbevax, also based on proteins, have been shown to be more than 90 % effective after three doses, but have not been pre-qualified by the WHO and their overall distribution is minimal. Vaccine induced immunity decreases over time and requires revaccination[xv]. In addition to the individual benefit of vaccination in reducing mortality, there is a potential benefit in transmission to third persons (externality), if it reduces the viral burden on mucous membranes. This benefit is limited in vaccinated people[xvi], who continue to carry the virus on mucous membranes with viral loads that have not been statistically proven to be lower than in unvaccinated pre-infected (with natural immunity). There is very little published and socialized information on natural immunity but cohorts of people infected with COVID-19 demonstrate better[xvii] and longer duration[xviii] (by memory cells in bone marrow studies) than induced immunity. The state of pre-infection could or should exempt the need for vaccination, but any country nor WHO have not considered such rationale[xix]. Some predict that by March 2022, 60 % of the world’s population will have been infected with COVID-19 variant Omicron[xx]: Their exemption from vaccination would have a very important social, economic and political impact. As regards the risk of vaccines, there is lack of transparency in pharma vaccine clinical trial dossiers[xxi]. On the other side, the very short duration of their follow-up before approval disables any mid or long-term safety assurance. There are reports of serious side-effects and deaths directly linked to vaccination[xxii] and myocarditis in young[xxiii] people, indicating 0.0000462 deaths (46 per million) per vaccine[xxiv]. These data enable estimates of risk-benefit, even with only one year of evolution after vaccination, and by age groups, given their very different fatality rate as above mentioned. These data pose the question on their use in young people and even more in children. Given the short monitoring period, the risk of vaccination in the medium to long term is even more uncertain, in particular by the novel mechanism of mRNA or DNA based vaccines and their potential interaction with the human genetic structure[xxv]. Fragments of viral mRNA are known to find reverse transcriptase enzymes and integrate into the human genome in the natural infection process, so vaccination with mRNA copies at much higher concentration than a natural infection may potentially mean reverse transcription into DNA and integration into the human genome of germ cells and even haploid gametes, with potential long term reproductive effects. Although this risk has been considered minimal given the volatility of mRNA in blood circulation, the risk of genetic alteration and its long-term effects in relation to oncogenesis (e.g. HBV[xxvi], HCV, papilloma[xxvii])[xxviii], autoimmune or degenerative processes (as recently seen between Epstein Bar virus and multiple sclerosis[xxix]) cannot be fully excluded. In terms of treatments, statistically significant effect on reducing mortality has been proven in intensive care and ventilation (CPAP[xxx] and assisted) in cases of respiratory failure and with nirmatrelvir-ritonavir[xxxi] in severe cases (every 12 hours for 5 days) at a cost of about USD 500 per patient[xxxii] (although a pool of patents has been opened). In such treatments, the most important issue is equity of access rather than the risk benefit deemed sufficient to justify such therapies in severe cases.
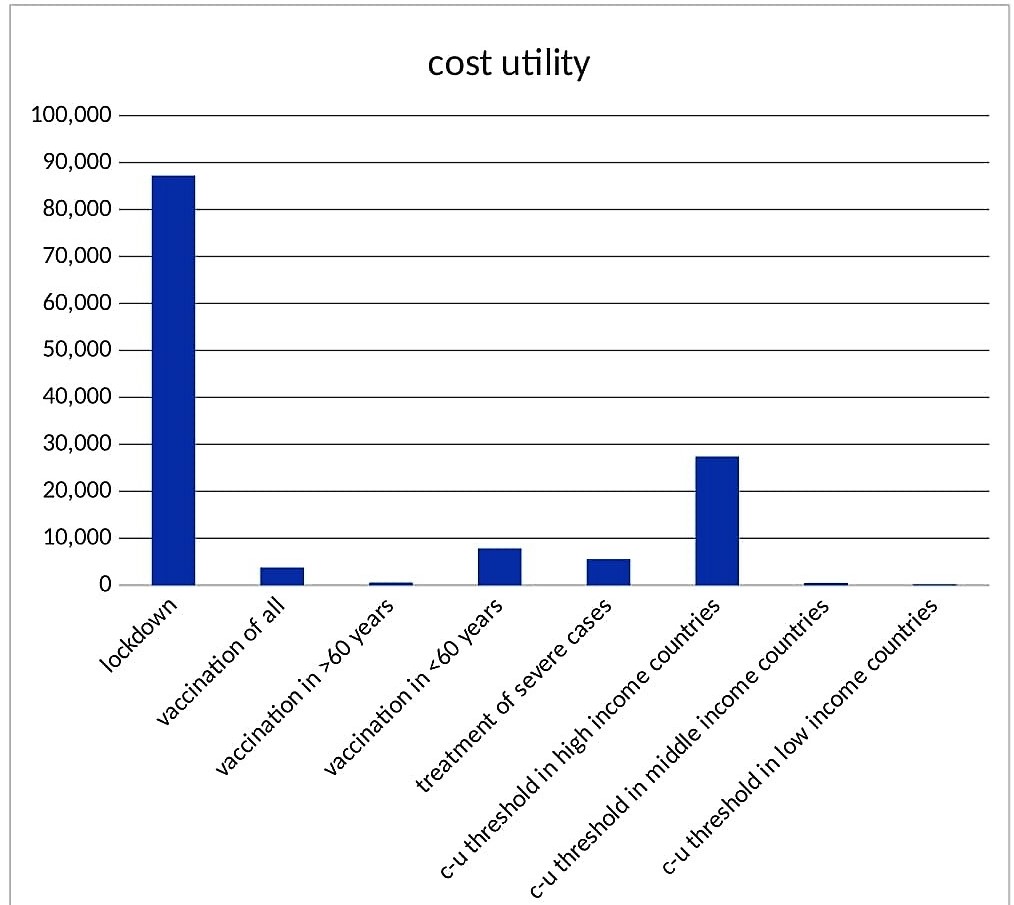
- Cost utility: Utility is measured in healthy life years (DALYs) that an intervention protects (prevents loss) or recovers (by treatment). As mentioned above, there is no absolute evidence of the usefulness of the generalised lockdown measures, as there are no case studies on control and validity of cohorts to demonstrate this, even less disaggregated by age and risk factors, and the uncertainty of risk-benefit for groups with lower risk of COVID-19 related mortality, as discussed above. Even assuming that the lockdown measures could have halved the transmission of the virus and its consequent mortality, the burden of the disease prevented would have been around 32.58 million life years. The global lockdown has caused at least 3.363 % on average annual GDSP[xxxiii], or about USD 2.85 trillion. Therefore, the cost utility of the overall lockdown may be around $87,210 per life year potentially lost by COVID-19. Compared to other public health measures, the World Bank and WHO consider relevant interventions of less than $150 per life year in low-income countries and below $500 per ADV in middle-income countries[xxxiv]. By comparison, the threshold for utility cost of interventions in the UK public system is $27,400[xxxv] and can reach $100,000 in US private insurance[xxxvi], governed by studies of intention to pay by life year. It is striking to see what is the value (or the cost worth investing) of one year of life according to the income levels and the strong correlation with GDP per capita. It is even more telling when we estimate that value to a human life taking into account the world average life expectancy: from some $10,500 in a low- income country to some $ 7 million in high income groups in high income countries. The global lockdown has been most expensive public health intervention in history and at a highest cost per life year, over 5,800 times higher than public health interventions advised by WHO and World Bank in low-income countries. In terms of vaccination, the cost of the available vaccines together with that of distribution by the health system is about $50 per dose. At one dose per six months according to current frequency, the annual cost is around $100 per person. Assuming efficacy rates of 90% in preventing mortality, it could prevent some 29.3 million life years meaning that the of the overall cost utility would be around $26,620 per life year, which is less than the lockdown but still far above the recommended cost utility of public health programmes in middle and low-income countries. Vaccination of the population over 60 years of age or with risk factors would cost ten times less (as it accounts to 10% of the world’s population) and result in an impact of 90 % of the overall vaccination (as 90% of deaths take place in older than 60 years). Such strategy would also ease the concerns of the risk-benefit considerations described above. The cost utility of vaccination of the population over 60 years of age would therefore be $2,957 per life year. Taking into account the reported benefits of vaccine manufacturing corporations (around $30,000 million for the 12,000 million doses sold), the possible production cost of the vaccines would be around $1.3 per vaccine (sold now at $15-25 per dose). Hence, the cost utility of vaccination over the age of 60 in the world with off-patent vaccines would be $147 per life year, in the affordability range of public health interventions regardless the income levels. In terms of treatment, the cost of entering ICUs and applying mechanical ventilation (CPAP and assisted) during the average 6-day duration, is about $7,500 per patient (in high-income countries the average is $30,000 per admission). Pfizer’s nirmatrelvir-ritonavir is sold at about $500 per treatment course in severe cases. Reducing the mortality of severe cases by 80 % would prevent the loss of some 26 million life years at a cost of about 144,000 million, (10 % of the 160 million cases diagnosed per year x 8 days of average stay in ICUs and treatment of nirmatrelvir-ritonavir). The cost utility of the treatment of severe cases is around $5,538 per life year, beyond the economic reach of low-income or middle-income countries.
Figure 5: Estimates of cost utility of the measures taken to fight the COVID-19 pandemic in relation to the utility cost thresholds used in countries according to income per capita
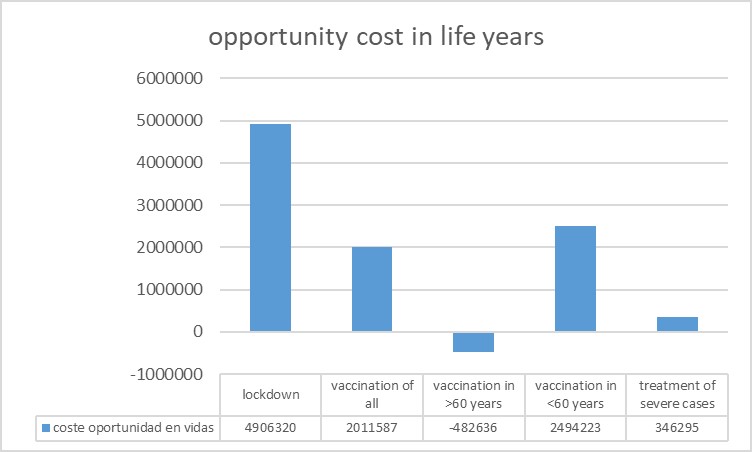
- Opportunity Cost: Comparing the cost of COVID-19 control strategies (or loss of economic income) and its impact on the prevention or recovery of healthy life years with those of other public health interventions lacking coverage enables to estimate the cost in life years, and in saved lives, of an excessive cost utility to tackle the COVID-19 pandemic. There are still many prevention and treatment interventions for the main causes of loss of healthy life years (see Table 1: Infectious diseases – including diarrhoea, respiratory, malaria, tuberculosis, HIV- and chronic non-infectious diseases – including diabetes, hypertension and its consequences of cardio and cerebrovascular diseases, kidney diseases, lung, colon, prostate and breast cancer). The average cost utility of those interventions is around $1,000 per life year in low- and middle-income countries. The cost and economic loss of the global lockdown could have reduced half of the economic inequity gap and prevent around 224 million indirect life years. Regarding vaccination, the full coverage of vaccination would cost some $780,000 million for the protection of some 29.3 million life years. The selective coverage of all people over 60 years of age in the world -10 % of the global population – would cost some $78,000 million for the protection of some 27.8 million life years while easing mobility of the youth and, monitored by periodic IgG testing, enabling the development of natural immunity. This option is considered highly controversial but the risk benefit, cost utility opportunity cost and –see below- equity analysis call for age-selective vaccination to be considered. The opportunity cost of vaccinating all under-60 years could have been protected some more than 700 million life years, some 20 million preventable deaths.
Figure 6: Opportunity cost in life years and deaths avoided by decisions of high utility cost vs different COVID 19 measures
The following chart summarises the indicators analysed in relation to the measures taken and currently in force and imposed even through mandatory compliance laws:
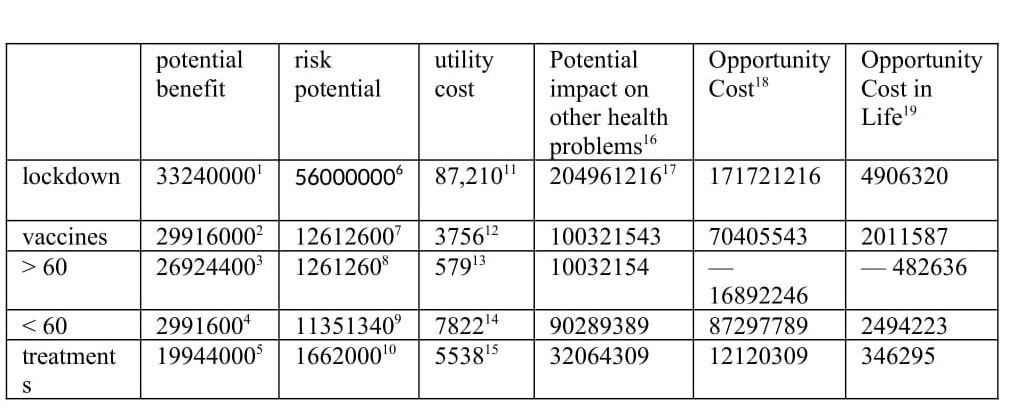
1: Estimating that half of the deaths that have occurred may have been prevented by lockdown

2: Estimating 90 % average efficacy of the current available vaccines

3: Taking into account that over 90% of deaths are in people over 60 years old, and that they account for 10 % of the world’s population.

4: Taking into account that < 10 % of deaths are in people under the age of 60, and that they account for 90 % of the world’s population.

5: Taking into account 60 % effectiveness of intensive care treatment in patients with COVID-19 severe disease..

6: Assuming that the lockdown has increased the overall burden of health inequity by 10 %.

7: By attributing the mortality rate observed in the United States attributed to COVID -19 vaccination.

8: The former applied to the proportion of people over 60 years of age..

9: The former applied to the proportion of people below 60 years of age...

10: It results from applying 5 % mortality rate due to side effects of ICU treatments in severe cases.

11: Overall economic loss divided by the potential benefit described above.

12: It results from applying the vaccine and distribution system cost of approximately $50 per dose and two doses per year to the entire world population and divided by the potential benefit described above.

13: Idem at 10 %, over the age of 60.

14: Same as 90 % below the age of 60.

15: Same as for severe cases.

16: It results from applying the economic losses of the overall lockdown to equitable economic redistribution and its potential impact.

17: The cost of each intervention is applied to measures with a weighted average utility cost among high-income countries (10 % of the world’s population), a cost utility of $30,000 per life year, middle-income countries (40 %), of 500 $ and low-income countries (50%) of $150.

18: This is the result of subtracting the potential impact on other interventions from the measure itself for COVID-19.

19: It results from estimating preventative deaths by dividing the opportunity cost in life years by the average age of premature deaths (half of the world average life expectancy: 35 years).
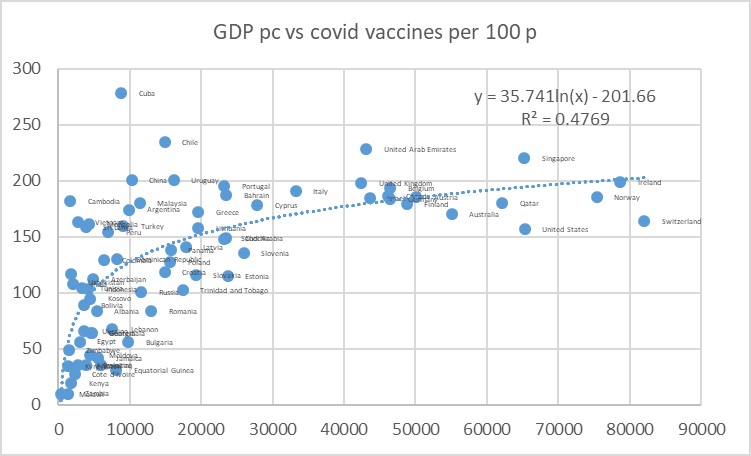
- Equity: It is the fair distribution of inequality. It is the measure of the only international commitment in global health, Article 1 of the Constitution of the World Health Organisation: “the best possible health for all”. We have defined the best feasible level of health as the one of countries or regions with life expectancy higher than the international average (H: healthy), flow of economic resources (GDP per capita) and wealth (assets) below the international average (R: Replicable in terms of economic resources) and with availability (bio-capacity per capita) and use of natural resources (carbon footprint and ecological footprint) below the ecological sustainability thresholds- or planetary boundaries (S : Sustainable in the use of natural resources). The disaggregated mortality rates by age and sex of such HRS references are compared to those observed in each country. The resulting excess mortality constitutes the net (number of deaths) or relative (proportion of deaths in excess of the total) burden of health inequity. Based on available data on national averages, the net burden of inequality between 2016-2020 was on average 16.11 million deaths and the relative burden 28 % (32 % for women and 23 % for men)[xxxvii]. 84 % of the net burden/excess mortality (13.53 million) occurred in countries with GDP per capita lower than the healthy-replicable-sustainable (HRS) references, which defined the ‘dignity threshold’, of around $10.7 per day (5.7 times higher than the ‘poverty threshold’ defined by the World Bank. The symmetrical level of GDP per capita from the dignity threshold and over the international average marks the threshold above which other countries do not have enough economic resources to enable the feasible level of health-for-all, are not compatible with planetary boundaries and do not improve life expectancy or wellbeing beyond the mentioned threshold. More than half of the world’s population lives in countries with GDP bps below the dignity threshold (in the deficit area) and therefore without the possibility to have a life expectancy that is feasible (indeed, with less than half of global economic resources) and sustainable for the next generations. The economic redistribution needed to prevent those 13.5 million deaths per year is equivalent to 7.77 % of global GDP, 10.6 % of the GDP above the excess threshold (as opposed to the current 0.18 % ODA). Regarding the COVID-19 pandemic and as previously mentioned in Figure 3, there is no statistically significant relationship between GDP per capita and COVID-19 mortality rate, both in 2020 without vaccines and in 2021 with vaccines. However (Figure 7), there is a clear correlation between GDP per capita and COVID-19 vaccination coverage (r2 = 0.4769: Almost half of the change can be explained by GDP per capita). Assuming its effectiveness in reducing morality by 90 % for those infected, the vaccination deficit would have resulted in an unjust and preventable excess of 2,056,462 deaths to date.
Figure 7: Vaccines vs COVID-19 per 100 inhabitants vs GDP pc, by country
Conclusions
While we cannot be sure (partly due to the absence of population sero prevalence studies) of the real COVID-19 incidence (most probably underestimated by official data) or its case fatality (most probably overestimated), available data during 2020 (without vaccination) and 2021 (with availability of vaccines even with high unjust access) point at a loss of around 32,580,000 life years in the world population. This loss (burden of disease without taking into account disability weight) is 1.96 % of the loss of life years for all diseases. Moreover, recent studies suggest that direct virus mortality may really be some 60 % of the reported (co-morbidity with positive PCR), so the proportion of the loss of life years due to the pandemic would be lower, some 0.76 % of the total. In relation to the risks that cause the greatest loss of life years, the pandemic has resulted in less than 10 % of the loss of life years due to the effect of tobacco, agro-industry diets (in both cases with massive marketing funding) or sedentarism, exacerbated by the widespread lockdown measures. The evolution of the pandemic, both in countries with high vaccination and low vaccination coverage, suggests that, through natural and induced immunity together with mutations in new variants -as the latest Omicron-, the virus is adapting and reducing its morbidity and human mortality, as it happened in previous coronavirus pandemics.
As regards the measures taken against the pandemic at global level and at national and sub-national levels, these have led to an unprecedented cost or economic loss in the history of public health, which deserves consideration without prejudice or ideological, economic or political bias. The benefit of lockdown and vaccination has not been studied disaggregated by age groups, general and COVID-19-specific immunity status and risk factors. On the other side, the short, medium and long-term side-effects of lockdown on physical, mental and social health and indirect health due to economic contraction, as well as those through vaccination, are not entirely known, less so in the medium and long term. On the other hand, the cost utility of the measures taken has been up to $87,210 per year of life protected by the lockdown, $23,620 for vaccination and $5,538 for treatment of severe cases, far from the thresholds of cost utility recommended by the WHO and the World Bank -and the influence of the latter by conditional credits- for low-income countries ($150 per life year) and even for high levels of private income (as recommended by the WHO and the World Bank (and the influence of the latter by conditional credits) for low-income countries ($500 per life year) and even for high income countries. The opportunity cost of such interventions in relation to the lack of economic fair redistribution (in the case of lockdown) and the lack of coverage of other much more efficient (cost-effectiveness) public health interventions -in particular in low-income countries-, may have resulted in 5.2 million deaths due to the lockdown measure and around 4 million deaths due to the vaccination strategy of the whole population (which has been limited to half and 80 % in middle-income and high income countries) in relation to selective vaccination for older than 60 years.
The impact of the pandemic on global equity suggests that, while there is no higher burden in low-income countries (discriminated against in the right to health as described above), the effects of the economic contraction will most likely increase overall economic inequity and hence inequity in health, and vaccination coverage, biased towards middle-income and high income countries, has led to an unfair and preventable excess of 2,056,462 deaths in lower-middle-income countries and low-income countries.
Lack of Space for Evidence-based Debate on Pertinence of Strategies to Confront COVID and Potential Conflicts of Interest of media and Political Decision Makers
Big tech in alliance with major social networks have banned what they judge[xxxviii] as fake news and even questions on vaccine safety[xxxix]. In fact, the main social media and big pharma share capital interests through Black Rock and Vanguard (soon to manage $ 20 trillion[xl]) major asset management firms[xli],[xlii] who exert major influence on governments worldwide[xliii] As a result, the space for open and transparent debate on pros and cons of the political decisions -mainly adhering to systematic lockdown and universal vaccination (with exclusive access to mRNA vaccines in high-income countries)- is very narrow[xliv] and hard to find. Big Pharma invested some $6.6 billion in advertising alone in the USA[xlv], which is more than the overall budget of the World Health Organization and six times its baseline budget from country contributions[xlvi]. The link to the overall political and media powers relates to the major gains of pharmaceutical corporations boosted by the COVID-19 pandemic which has meant direct profits of more than USD 30,000 million[xlvii]. Moreover, the public access to the information on protocols and side effects of the corporations’ clinical trials, and their contracts with purchasing countries, has been limited[xlviii]. The mentioned contracts include disclaimer clauses, which exonerate the companies’ responsibilities in case of severe side effects[xlix]. Such secrecy is even more bothering when the COVID vaccine producer leading the market, Pfizer[l], has paid during the last 20 years $4.7 billion in penalties and settlements for false marketing claims and health safety violations.
Parallelism with the Global Reaction to the AIDS Pandemic
What the world has experienced with the COVID-19 pandemic echoes what happened thirty years ago with the global expansion of AIDS in some respects:
- No systems were established and no attitudes were promoted to know the individual and collective serological status in order to gain a better understanding of their epidemiological dynamics and to steer public health and individual responsibility actions. Whereas conscious and ethical HIV seropositive persons should have prevented infecting seronegative persons (mainly through the use of condom, hampered by the Catholic Church and the US government through its PEPFAR programme), in the case of COVID-19, those without IgG antibodies (rather than volatile PCR or antigen negative status) should have been subject to lockdown and vaccination while sero positives could have avoided the extreme degree of economic contraction, strengthened social services for older people and possibly led to herd immunity.
- At that time and now, there was no comprehensive funding system for research into global public goods against the pandemic, i.e. universal access to effective and safe diagnostic tests, treatments and vaccines. In the case of AIDS, from the discovery in 1996 of anti-retroviral combined therapies that prevented death, to the establishment of the patent pool in 2004, around two million people died per year while corporations shielded patents, charged unaffordable treatment[li] prices, and gained some $20,000 million profits even after recovering research investments (to a large extent originally financed by public systems). In the case of the COVID-19 pandemic, since the knowledge of effective vaccines in 2021 (even with the uncertainty of medium and long-term side effects), the main private Pharma corporations producing COVID mRNA vaccines distributed in high income countries have also protected patents and rejected to join any knowledge and patent pool. The high margins and the patent monopoly has fuelled profits while paying low tax revenues[lii]. The high prices, together with the need of expensive ultra-cold chains, has de facto prevented most of the population in low and low-middle income countries from access to COVID vaccination. According to the efficacy rates some two million deaths could have been prevented had the COVID vaccine covered all persons over 60 years of age in the world regardless their country of origin or income level.
- The stigma during the AIDS pandemic fell on those infected who came forward revealing their status while during the COVID pandemic the stigma is falling on those who question the systematic lock down and the vaccination to all age groups in terms of risk benefit and opportunity cost.
Recommendations
- Global redistribution of economic resources towards global economic equity that can prevent more than 10 million unfair deaths per year.
- Promote healthy lifestyles correlated with sustainable ecological and carbon footprint for new generations and prevent more than two million deaths per year due to the effects of climate change in the rest of the century, hitting the least polluting countries harder.
- Global equitable financing of a globally accessible research and public goods fund, outlawing knowledge patents for vital and life-saving knowledge and goods (oxygen, water, natural food, essential medicines).
- Access to serological tests on a regular (monthly?) basis to identify persons and groups at risk and their responsibility — moral and legal — to avoid infecting other persons, in particular higher risk groups (over 60 years old and with risk factors).
- Comprehensive access to effective and safe vaccines (support to pre-qualification processes for Cuban vaccines and Corbevax) with global sequential coverage staring with the priority for people over 60 years old and with risk factors.
- Assess the pertinence of vaccination in younger age groups in terms of risk/benefit, cost-effectiveness and opportunity in relation to other global health challenges.
This must be based on an open and uncensored, evidence-based debate based on the universal right to health and the ethical principle of equity.
References
[i] Https://www.ncbi.nlm.nih.gov/pmc/articles/PMC7584920/
[ii] Https://www.thelancet.com/journals/langlo/article/PIIS2214-109X (20) 30544-1/fulltext.
[iii] Https://www.ajtmh.org/view/journals/tpmd/104/6/article-p2176.xml
[iv] Https://www.pnas.org/content/118/21/e2105968118
[v] Https://www.england.nhs.uk/statistics/statistical-work-areas/covid-19-hospital-activity/
[vi] Https://www.who.int/data/gho/indicator-metadata-registry/imr-details/159
[vii] Https://www.healthdata.org/gbd/2019
[viii] Https://elpais.com/sociedad/2022-01-14/los-datos-de-hospitalizados-con-el-coronavirus-incluyen-hasta-un-40-de-pacientes-ingresados-por-otras-dolencias.html
[ix] Https://www.worldometers.info/coronavirus/coronavirus-age-sex-demographics/
[x] Https://ourworldindata.org/grapher/total-covid-cases-deaths-per-million
[xi] Https://www.cebm.net/covid-19/masking-lack-of-evidence-with-politics/
[xii] Https://www.ncbi.nlm.nih.gov/pmc/articles/PMC8685753/
[xiii] Https://journals.plos.org/plosone/article?id=10.1371/journal.pone.0255251
[xiv] Https://www.healthdata.org/covid/covid-19-vaccine-efficacy-summary
[xv] Https://www.nejm.org/doi/full/10.1056/nejmoa2114228
[xvi] Https://www.thelancet.com/journals/laninf/article/PIIS1473-3099 (21) 00690-3/fulltext.
[xvii] https://www.medrxiv.org/content/10.1101/2021.08.24.21262415v1.full
[xviii] Turner, J.S., Kim, W., Kalaidina, E. et al. SARS-CoV-2 infection induces long-lived bone marrow plasma cells in humans. Nature 2021
[xix] Https://www.bmj.com/content/374/bmj.n2101/rr-0
[xx] Https://www.healthdata.org/covid/video/insights-ihmes-latest-covid-19-model-run
[xxi] Https://www.transparency.org/en/press/covid-19-vaccines-lack-of-transparency-trials-secretive-contracts-science-by-press-release-risk-success-of-global-response
[xxii] Https://www.bmj.com/content/373/bmj.n1372/rr-2
[xxiii] Https://pubmed.ncbi.nlm.nih.gov/34614329/
[xxiv] Https://www.cdc.gov/coronavirus/2019-ncov/vaccines/safety/adverse-events.html
[xxv] Https://www.pnas.org/content/118/21/e2105968118
[xxvi] Https://www.ncbi.nlm.nih.gov/pmc/articles/PMC4065878/
[xxvii] Https://www.ncbi.nlm.nih.gov/pmc/articles/PMC523272/
[xxviii] Https://www.ncbi.nlm.nih.gov/pmc/articles/PMC6212953/
[xxix] Https://www.science.org/doi/10.1126/science.abj8222
[xxx] Https://pubmed.ncbi.nlm.nih.gov/33889343/
[xxxi] Https://www.pfizer.com/news/press-release/press-release-detail/pfizer-announces-additional-phase-23-study-results
[xxxii] Https://www.precisionvaccinations.com/2021/11/18/pfizers-covid-19-oral-antiviral-cost-529-course
[xxxiii] Https://data.worldbank.org/indicator/NY.GDP.MKTP.KD.ZG
[xxxiv] Https://pubmed.ncbi.nlm.nih.gov/32812212/
[xxxv] Https://www.gov.uk/guidance/cost-utility-analysis-health-economic-studies
[xxxvi] Https://www.sciencedirect.com/science/article/pii/S1098301519301482
[xxxvii] http://www.peah.it/2021/04/9658/
[xxxviii] https://sundial.csun.edu/167028/opinions/having-big-tech-in-charge-of-censorship-is-a-slippery-slope-to-disaster/
[xxxix] https://www.newsweek.com/big-tech-censorship-covid-information-leads-vaccine-hesitancy-opinion-1644051
[xl] https://www.bloomberg.com/news/features/2017-12-04/blackrock-and-vanguard-s-20-trillion-future-is-closer-than-you-think
[xli] https://diario16.com/que-tienen-en-comun-los-principales-medios-de-comunicacion-y-las-farmaceuticas-pfizer-moderna-o-astrazeneca/
[xlii] https://childrenshealthdefense.org/defender/blackrock-vanguard-own-big-pharma-media/
[xliii] https://prospect.org/economy/blackrock-rules-world/
[xliv]https://www.amnesty.org/en/latest/news/2021/10/covid-19-global-attack-on-freedom-of-expression-is-having-a-dangerous-impact-on-public-health-crisis/
[xlv] https://www.fiercepharma.com/special-report/top-10-ad-spenders-big-pharma-for-2020
[xlvi] https://www.who.int/about/accountability/budget
[xlvii] Https://www.oxfam.org/en/press-releases/pfizer-biontech-and-moderna-making-1000-profit-every-second-while-worlds-poorest
[xlviii] https://www.transparency.org/en/press/covid-19-vaccines-lack-of-transparency-trials-secretive-contracts-science-by-press-release-risk-success-of-global-response
[xlix] https://www.cnbc.com/2020/12/16/covid-vaccine-side-effects-compensation-lawsuit.html
[l] https://www.statista.com/statistics/1198516/covid-19-vaccinations-administered-us-by-company/
[li] Https://supreme.findlaw.com/legal-commentary/profit-margins-death-rates-drug-patents-and-hivaids.html
[lii] https://actionaid.org/news/2021/pharmaceutical-companies-reaping-immoral-profits-covid-vaccines-yet-paying-low-tax-rates