IN A NUTSHELL Authors’ noteThis paper provides details regarding the health, nutritional and other human development indicators of the two poorest quintiles of one of Yadgir District, which is the most backward district of Karnataka, India. This is the district where we are attempting to strengthen the process of human development

By Ms. Veena S Rao, IAS (Retd), Director

Ms. Harshita Chinnaswamy, Research and Project Assistant
Auro Centre for Public Nutrition, Public Health and Public Policy (ACPN)
Bangalore, India
By Veena S Rao on PEAH: see HERE
India’s Demographic Wake-Up Call
India’s population has reached its demographic prime. While large parts of the world are aging, around 67.3% of our population is between 15-59 years of age, and this demographic advantage of a young working population will persist for at least another three decades.
Approximately 26% of the population is below 14 years, and just 7% is above the age of 65, as against ~17% in the US and ~21% in Europe. By 2030, India’s working age population is projected to reach its highest level at 68.9%. The median age of the population will be 28.4 years, with a dependency ratio of only 31.2%. In absolute numbers, India will have 1.04 billion working age persons, constituting the largest work force in the world.
Our demographic harvest certainly has large numbers, but demographic strength does not lie in numbers alone. Large numbers can only translate into dividends through high productivity that drives wealth creation, not just by construction, but by high-tech production and manufacture, innovative information technology, new-age services with high value addition, R&D driven innovation, healthcare and life sciences, to name a few.
Does our demographic dividend have the capacity to enable its own transformational economic advancement on these lines and accelerate the nation’s GDP to reach the $7 trillion mark by 2030?
Clearly, this capacity can only develop with right education and skills, which require cognitive power (brain cells) and good physical health. Both start developing at foetal stage and continue developing through childhood and adolescence into adulthood, with proper health, nutritional and educational care. Only then can the demographic dividend have the capacity for higher learning, superior skills and qualifications to fit contemporary or futuristic job requirements. We may recall that other Asian nations invested heavily in health, education and skills during their growth periods and reaped full demographic harvests.
Let us take a look at our present demographic dividend, whose foundational stage has is mostly over. NFHS (National Family Health Survey) 5 (2019-2021) informs that among our present demographic dividend, (15-49 years), only 41 % women and 50.2% men have 10 years or more of schooling; 57% women and 25% men are anaemic; and 18.7% women and 16.2% men have Body Mass Index (BMI) below normal. It is not surprising therefore, that despite several skilling programmes being implemented in India, prospective employers are not able to find the right skilled workers, and unemployment rates of ‘educated’ youth remain high.
We had conducted a Baseline and Social Survey of two poorest quintiles in Yadgir District, Karnataka while implementing a project “Establishing SHG/FPO enterprises to address malnutrition and provide rural livelihoods in Yadgir, Karnataka.” Yadgir is what is now classified as an Aspirational District, as per Niti Aayog, India’s national think tank. (See Note)
The findings below show the human development status of our present demographic dividend within this group
- 60% SHG women and 91% of their spouses are unskilled workers, with mean annual income of women being Rs 17000 and their spouses being Rs 18000.
- All the respondents live in their own houses, 56% of their houses are pucca (concrete). 57% of these households have two-wheeler. Average family size of these households is 6.4 [1]
- Mean weight of SHG women was 54.5 Kg and mean height was 151.2 Cm. For spouses, respective figures were 60.0 Kg and 162.0 Cm.
- Using BMI-cut-offs, 12% SHG women and 12% of their spouses are categorized as underweight.
- Around 28% women below 30 years are underweight and this percentage decreases with age. 12.25% of spouses are underweight, the percentage increasing from 0% underweight below 30 years of age to 21.79% for the age group 50 years and above
- 5% mothers of children aged 3-5 years are illiterate and 57% mothers of children below 3 years are illiterate
Now let us turn to our immediate demographic dividend – today’s adolescent girls and boys, 15-19 years of age – who will form a substantial part of India’s work force for the next three decades.
From the little data available about them, NFHS 5 informs us that only 34% girls and 35.9% boys of age 15-24 have completed 12 years or more education; 59% girls and 31% boys of this age group are anaemic, and only 54.9% girls and 52.6% boys have normal Body Mass Index (BMI).
Below are the findings on Adolescent Girls and Boys (11-18 years) from our Baseline Survey of the two poorest quintiles
- 83% girls and 93% boys are attending school, with 75% attending government schools.
- With negligible gender-wise and age-wise variations, 12-13% and 23-24% adolescents were severely and moderately stunted respectively.
- 1% of adolescent girls between 15-18 years are severely stunted, as against 11.9% girls in the age group 11-14 years.
- 1% adolescent boys between 15-18 years are severely stunted as against 9.4% boys in the 11-14 years age group.
- Underweight as per BMI-cut-offs was slightly higher in boys (83%) as compared to girls (75%).
- Overall, about 47.39% adolescent girls and 52.49% adolescent boys are severely underweight, and 27.96% girls and 30.77% boys are moderately underweight.
- Among both girls and boys, underweight was highest among 11-14 age group as compared to 15-18 age group.
- 24% adolescent girls between 15-18 years are severely underweight, as against 60.32% severely underweight girls in the age group 11-14 years.
- 88% adolescent boys between 15-18 years are severely underweight as against 71.09% severely underweight boys in the 11-14 years age group
These statistics reflect reduced biological development, which could translate to poor learning. The Annual Status of Education Report (ASER) (Rural) 2023 national findings certainly corroborate this. Only 77% in the 17-18 years category could read Class 2 textbooks, and 35% could do division. National findings also revealed that the learning trajectory over Grades 5,6,7 and 8 was relatively flat, meaning thereby that the difference in learning levels between all the grades was not very much. It is these age groups that will feed our demographic dividend for the next 3 decades.
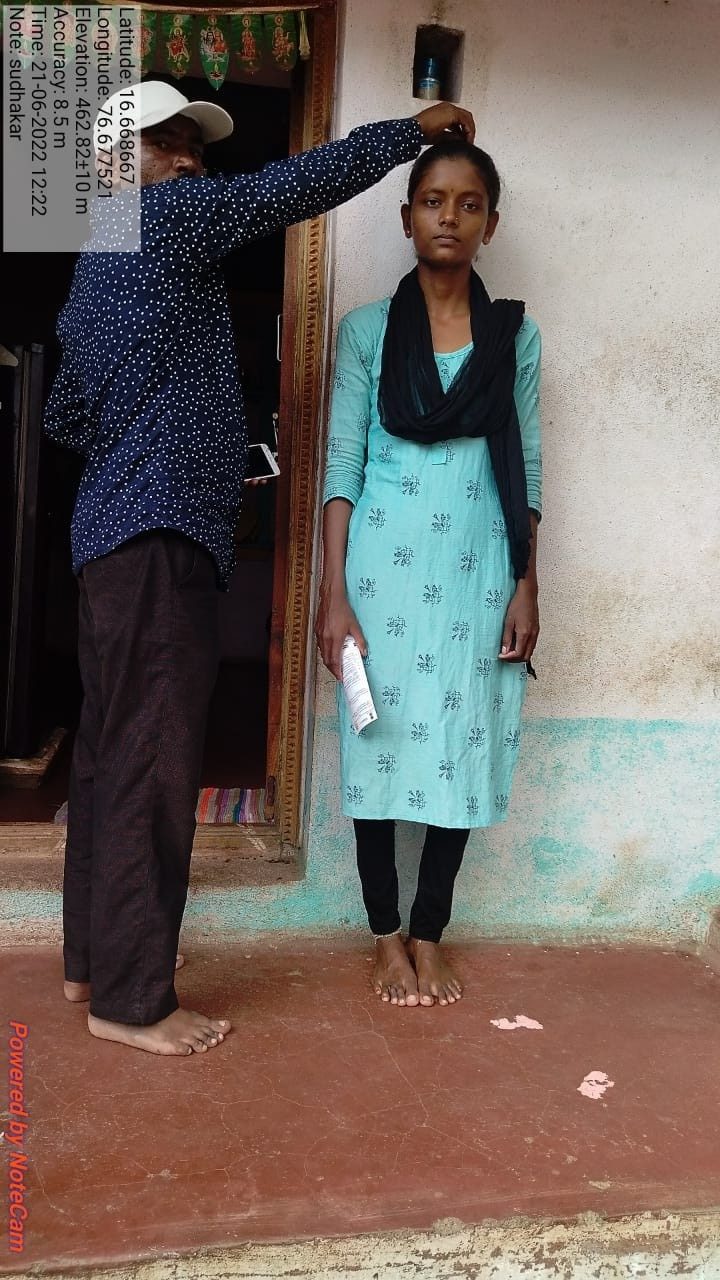
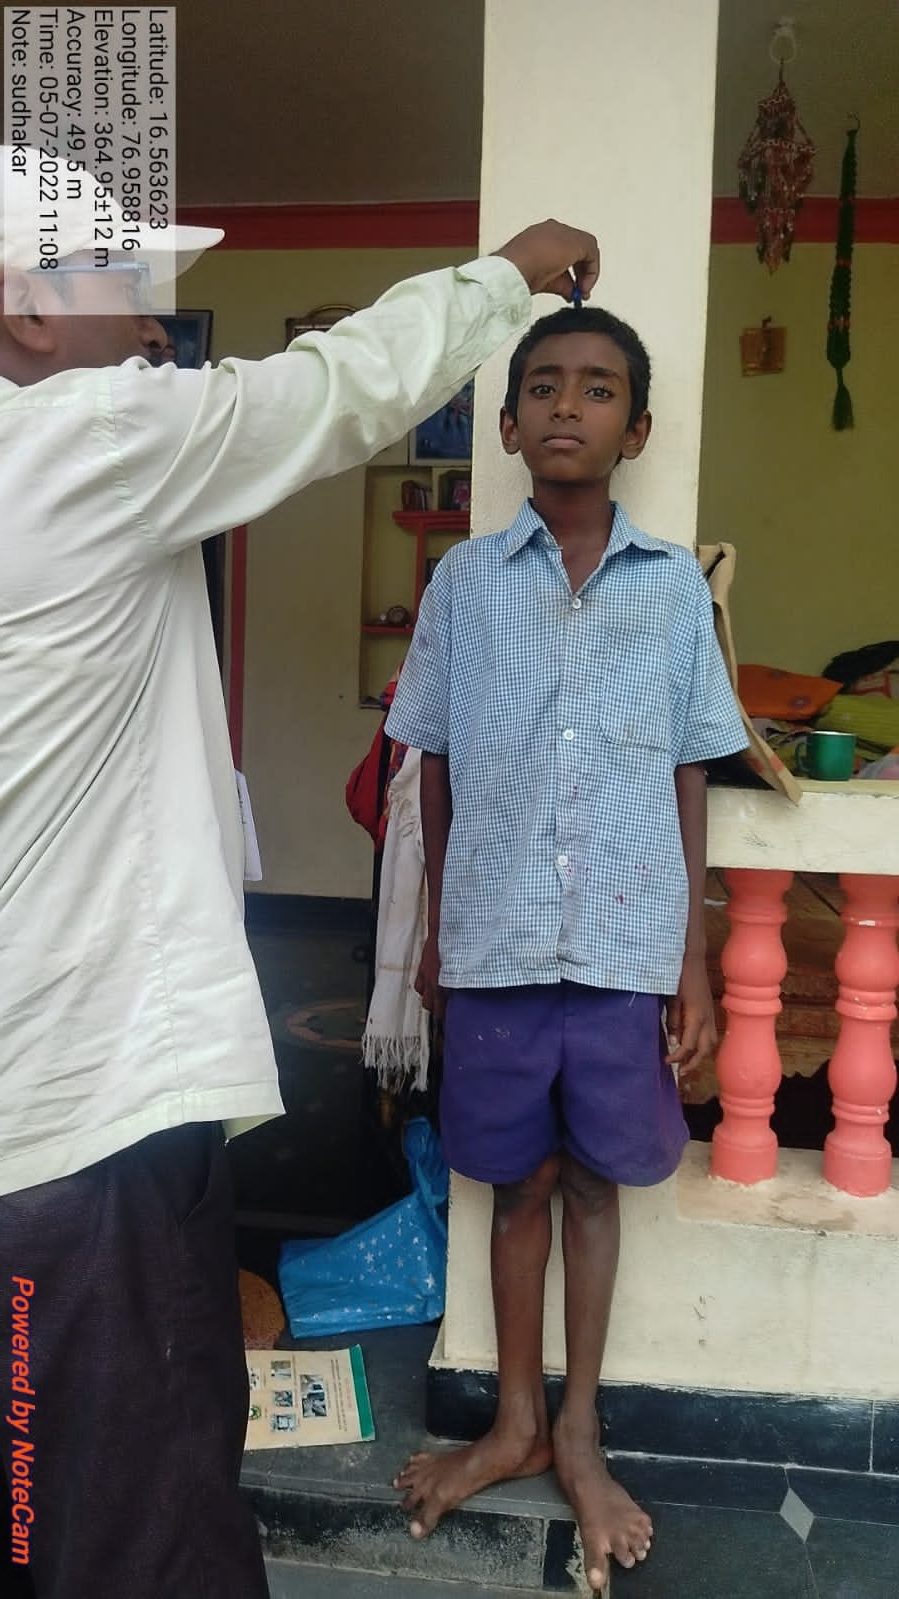
Anthropometric measurements of adolescent girl and boy being taken by project staff
Let us take a look at our future demographic dividend, which will enter the work force within the next one or two decades – our children.
Not a very bright picture either. According to NFHS 5, 35.5% of children below 5 years are stunted, 19.3% are wasted and 32.1% are underweight; and 67.1% children between 6-59 months are anaemic. (Figures for the 2 poorest quintiles are almost 50% higher) NFHS does not give us figures of the percentage of children who are neither stunted, nor wasted, nor underweight. But most shockingly, only 11.3% children aged 6-23 months are receiving minimal adequate diet, an improvement from 9.6% as in NFHS 4 (2015-16). The foundation of our demographic dividend and human capital for the next 3 decades lies here.
This is what the Baseline Survey had to show about children of the two poorest quintiles
- Mean duration of breastfeeding among 6-35 months male children was 15.6 months and 17.4 months among female children.
- 20% of children did not receive any complementary feeding until 23 months
- Of the remaining 80%, only 34% children aged 6-35 months old children received complementary feeding before 8 months. 56% children received complementary feeding at 8-11 months and 10% received complementary feeding after one year.
- Around 50% mothers do not cook the supplementary food they receive from Integrated Child Development Scheme (ICDS) due to lack of time as they have to go to work.
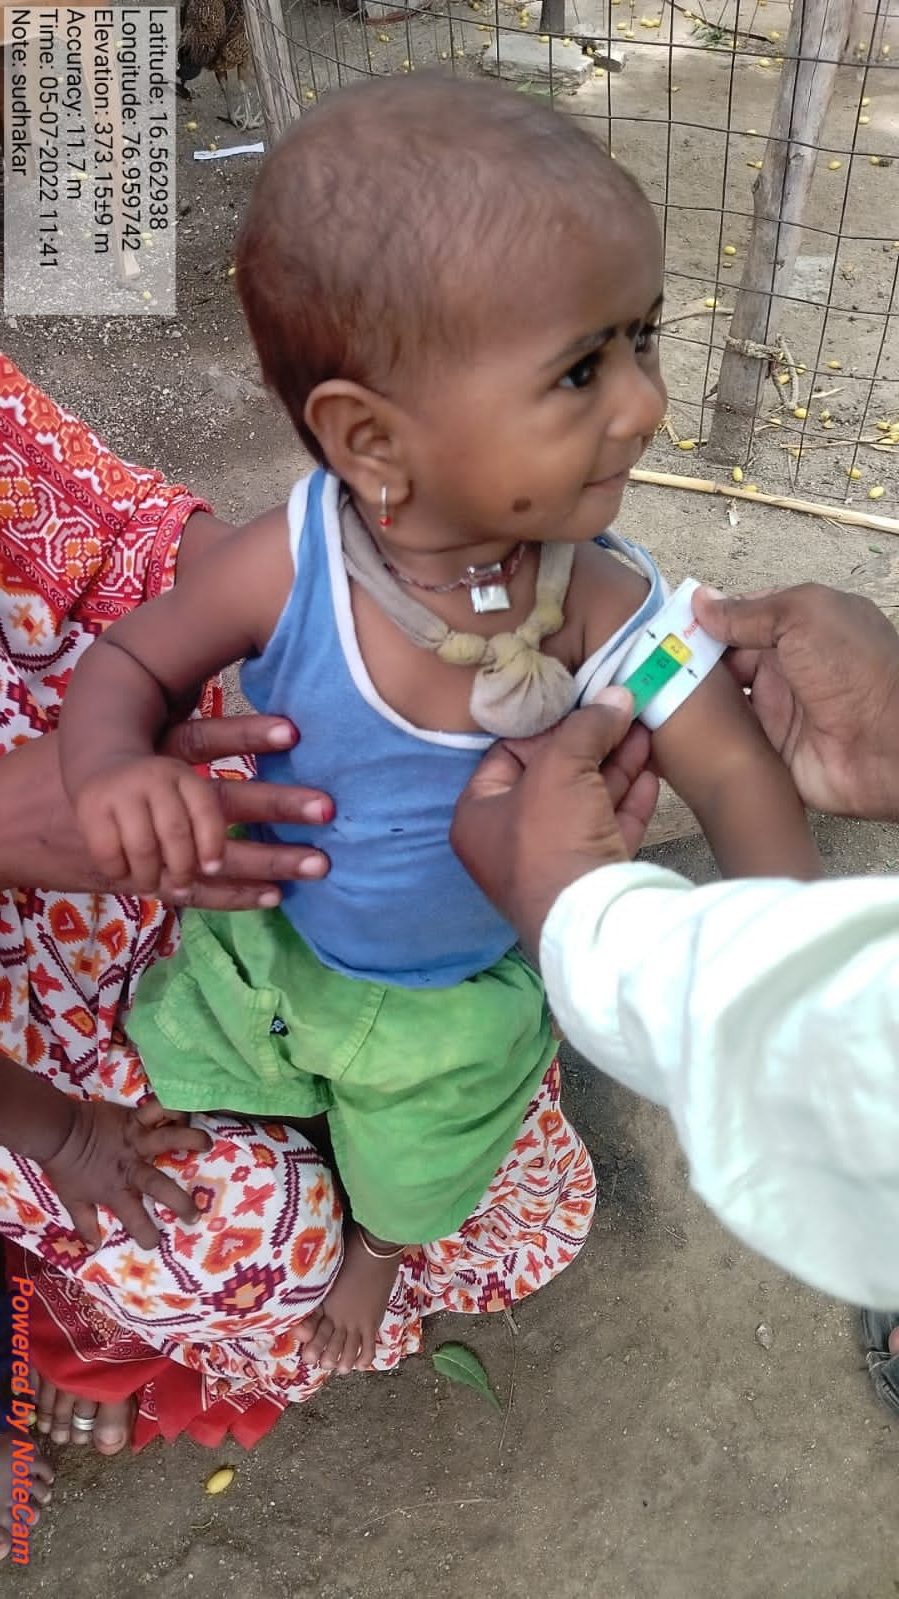
Anthropometric measurements of 6–35-month children
- Stunting:1% and 27.5% children were severely and moderately stunted respectively. Stunting was highest (54%) among 24-35 months children and lowest (20%) among 6–11-month-old-children.
- Data indicated that as the age of the child increased the extent of moderate and severe stunting among children also increased. While 6.4% of children less than a year are severely stunted, a proportion of 20.1% among children aged 1 to 2 years and 22% among children aged 2 to 3 years are severely stunted
- Wasting: Around 14% children were severely wasted and 14% were moderately wasted. Children below 1 year had 9% moderate wasting and 12% severe wasting. Children aged 1-2 years had 13% children with moderate wasting, and 20% with severe wasting. Among children aged 2-3 years, 16% children were moderately wasted and 8% severely wasted. Proportion of children with moderate and severe wasting is higher among children aged 1 to 2 years (33%) compared to those aged 2 to 3 years (24%) and under one year (21%).
- Underweight: 6% and 26.6% children were severely and moderately underweight respectively. Underweight was highest among children aged 24-35 months (56%), lower (44%) among children aged 12-23 months and lowest (33%) among 6–11 months old children.
- Percentage of children who are not underweight decreases as the age of the child increases, from 66.67% for children below 1 year to 56.29% among aged 1 to 2 years and 43.20% among children aged 2 to 3 years
- 60% female and 70% male children were either stunted or wasted or underweight.
- The number of children who are not stunted, not wasted and not underweight is 55.13% below 1 years, 34.2 % among 1 to 2 years, 27.65% among 2 to 3 years
- The average MUAC (Mid-Upper Arm Circumference) is 13.7 cm. 82.87% children have normal MUAC; 15% children have MUAC between -3SD to -2SD; and 2% children have MUAC < -3SD.
- MUAC decreased with increase in age of child.
Anthropometric measurements of children being taken by field staff
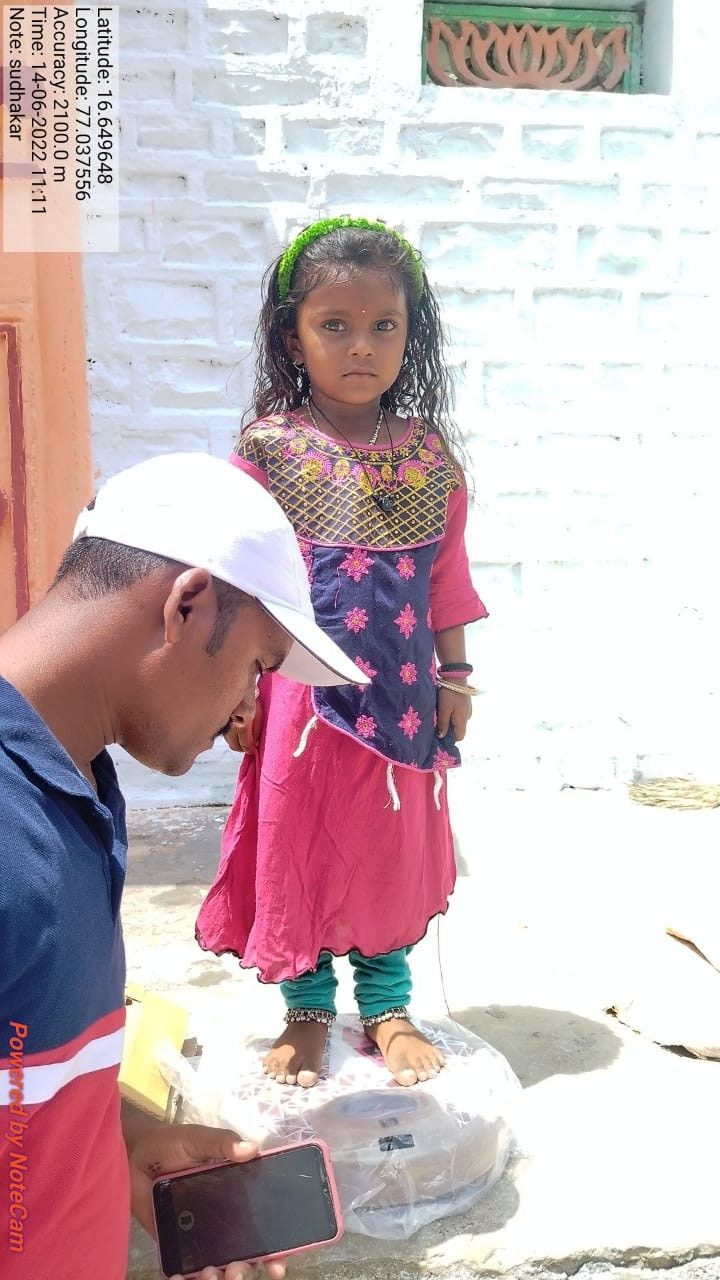
Anthropometric measurements of 3-5 years children
Stunting:
- With minimal taluka-wise and age-wise variations, 26.5% and 23.5% children were severely and moderately stunted respectively. With increase in age there was decrease in percent stunted children.
- Among the children aged 3 years, 34% are moderately stunted and 22% are severely stunted. Among the 3-4 year old children, 29% are moderately and 20% are severely stunted. Among the 4-5 year old children, 25% are moderately stunted and 22% are severely stunted.
- The proportion of moderate and severe stunting is higher among 3 year olds (56%) when compared to four year old children (49%) and 5 year old children (47%).
Wasting:
- Around 12% children were severely and 28% were moderately wasted.
- The proportion of severely wasted children is 24% among children aged 5 years, 10.20% among children aged 4 years and 11.39% among children aged 3 years
- Moderate wasting rises from 3 to 4 year children, then drops for 4 to 5 year children, Severe wasting doubles from 3 to 5 years
Underweight:
- 5% and 29.4% children were severely and moderately underweight respectively.
- Severe underweight is highest at 5 years and moderate underweight is highest at 3 to 4 years
- 2 % children have normal MUAC and 2.7% children have MUAC between -3SD to -2SD
- Percentage of not wasted, not stunted and not underweight children marginally improves, and decreases from 74.68 at 3 years to 70.75 at 4 years.
- Based on combined analysis, 74% female and 72% male children were either stunted or wasted or underweight among 3–5-year-old children
Medical science confirms that brains develop fastest before the age of 5 than during any other time in our life, and lay the foundation for the physical, mental, and emotional development in life. According to Centre on the Developing Child of Harvard University, 90% of a child brain’s development happens during the first years.
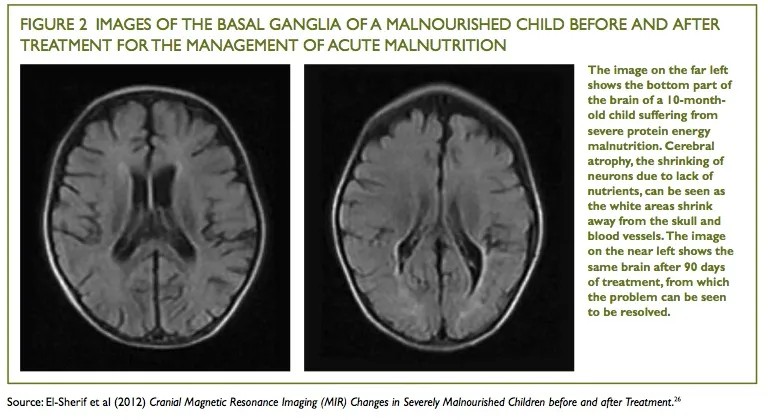
Studies have recorded through Magnetic Resonance Imaging the deficient brain development of malnourished children as compared with non-malnourished children. Therefore, the first casualty of the 88.7% children under 2 years not receiving minimal, adequate diet will be their brain development. India’s routine dietary deficit, both macro and micro, among at least 40% of our population among all age groups is well documented in our own national surveys. It is not therefore surprising that the resultant under-nutrition, poor health and morbidity, prevents children and adolescents (our demographic dividend) from achieving their complete cognitive and physical potential, (refer ASER Report) and thereafter prevents them from accessing the best opportunities for education and skills for emerging high value employment. Hence the mismatch between available skills or the capacity to acquire the required skills, and today’s job market.
Undoubtedly, our demographic dividend is deeply divided. At the top are a section of our professionals with the highest qualifications and leadership qualities, who head some of the mightiest corporations and businesses in India and abroad. But here in our own backyards, we have the 2 poorest quintiles of our immediate and future human capital who are not able to achieve their complete cognitive and physical potential and will not rise above subsistence level.
India will start aging with each passing year after 2030. The work force population will start declining and the ageing population will start increasing. A growing skill-less, asset-less, ageing population in poor health can become India’s greatest future burden.
Let us not be complacent that a large population, with or without skills, will strengthen our economy through high volume consumption. It is more probable that a large population with low skills and education will only increase unemployment and have little disposable income for high consumption. And let us not bank on the fact that there will be a flight of human capital from weaker sections to foreign lands where secondary labour is becoming scarce, or that they would be contracted as mercenaries in foreign armies.
The time to act is now. We must do a real-time situation analysis of our immediate and future demographic dividend and redesign our policy framework to strengthen our human capital through the life cycle. We must promote higher participation of women in the work force and enable our demographic dividend to capitalize the opportunities that lie ahead, through ensuring a sound foundation of better nutrition, health and education. After all, today’s child and adolescent is tomorrow’s professional, and GDP derived from the demographic dividend is completely commensurate with its health, education, skills and productivity. I am confident that some of the many think tanks of our country will think about this too.
Note: The Government of India in 2018 initiated the Aspirational Districts Programme with the aim to transform 112 most under-developed districts of the country, quickly and effectively. Aspiration Districts are the most under-developed districts across the country, with the highest levels of poverty, poorest health, nutrition and education status and deficient infrastructure. The broad contours of the programme are convergence of State and Central programmes, collaboration of Central, State and District administrators, and competition among the districts through monthly delta ranking, all driven by a mass movement. The ranking is based on the incremental progress made across 49 Key Performance Indicators (KPIs) under 5 broad socio-economic themes— Health & Nutrition, Education, Agriculture & Water Resources, Financial Inclusion & Skill Development and Infrastructure.
Link: https://www.niti.gov.in/index.php/aspirational-districts-programme
References
- Reaping the demographic Dividend EY India https://www.ey.com/en_in/insights/india-at-100/reaping-the-demographic-dividend
- NFHS 5- https://www.nfhsiips.in/nfhsuser/nfhs5.php
- NFHS 4- https://www.nfhsiips.in/nfhsuser/nfhs4.php
- https://documama.org/2013/06/07/food-for-thought-the-save-the-children-report/
- Baseline and Social Survey- https://publicnutrition.aurosociety.org/wp-content/uploads/2022/02/Baseline-and-Social-Survey-Yadgir.pdf
- ASER- https://asercentre.org/
- The Annual Status of Education Report (ASER) (Rural) 2023- https://asercentre.org/wp-content/uploads/2022/12/ASER-2023-Report-1.pdf
- Centre on the Developing Child of Harvard University- https://developingchild.harvard.edu/key-concept/brain-architecture/ https://files.firstthingsfirst.org/why-early-childhood-matters/the-first-five-years
—–
[1] This would normally include two elders, husband and wife and 2-3 children