Health is the most cherished human aspiration across cultures and time. The only global health objective agreed by all countries is the constitution of the World Health Organization, which aims at the “best feasible level of health for all”. With international data - from 1960-2020- we identified such “best feasible level of health” and selected countries with good health (life expectancy above world average) and also economic and ecologic conditions that are replicable for all, including coming generations. The identified models question the prevailing concepts of development and poverty thresholds. Using healthy, replicable and sustainable (HRS) models, we are able to adjust mortality rates by age and sex published by the UN Population Division every five years. The excess mortality above that from the HRS models is the burden of health inequity, a powerful indicator for socioeconomic justice. It also allows setting the “dignity threshold” (below which no country has achieved that best feasible health) and the equity curve, between such minimum and the maximum “excess level” above which global equity and sustainability is not feasible, and wellbeing  neither improves for those in that hoarding end. Accumulation above that threshold and carbon emissions above the “ethical threshold” above which we are bound to irreversible global warming > 1.5 degrees, has a price on life years lost in others, which we factored in an “equitable and sustainable wellbeing” index. The world could save 16 million lives lost every year to inequity with only half the GDP present levels and preserve the lives of coming generations, including by investing the unnecessary surplus into global public goods. Such shift to equity requires a change in values and a redistribution of some 7% of GDP, only 10% of the GDP above the unnecessary and unethical excess threshold.


“Enough is enough and more is too much”

Mahatma Gandhi
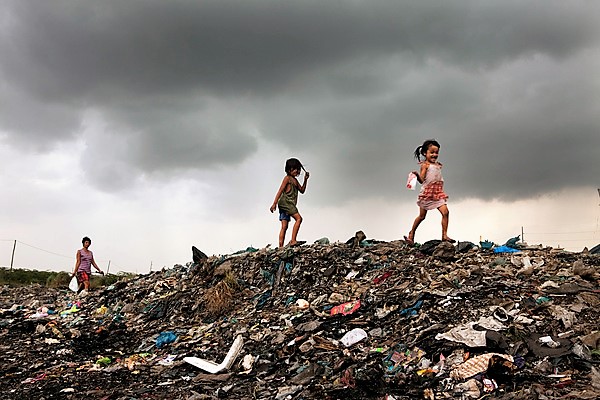
credit: WHO
Global Health Inequity 1960-2020
EQUITY VS. EQUALITY, DIGNITY VS POVERTY, EQUITABLE AND SUSTAINABLE WELLBEING VS HUMAN DEVELOPMENT INDEX
By Juan Garay*, Nefer Kelley**, David Chiriboga***, Adam Garay****
*Professor of Bioethics, Chiapas University, Mexico
**Bay area Community Resources, Berkeley, California
***University of Massachusetts, USA
****Sustainable Health Equity Movement
The views in this study and document do not necessarily reflect the positions of the organizations related to its authors
Scene setting
When the world was recovering from the major wars stemmed in Europe, it resolved to create system where all countries would preserve peace and respect human rights. Until then, just a handful of countries had taken the German Von Bismarck XIX century health care model from workers to the general population through universal health care systems. Norway and Sri Lanka[i] in the 30s and Costa Rica[ii] in the early 40s had committed to universal free health care. In the mid-40s, the Universal Declaration of Human Rights[iii] brought hope and a sense of brotherhood in a world ravaged by cruel massive wars, including its final blow of the nuclear bombs. Its article 25 declared the right of health and wellbeing, including through social protection. In parallel, the World Health Organization (hereafter WHO) defined health as a state of physical, psychological and wellbeing and its article 1 committed all member countries to strive for the “best feasible level of health for all peoples”[iv]. The 60s witnessed the wave of African independence broke the last colonial chains that had lasted four centuries while the WHO managed to coordinate the efforts to eradicate smallpox. The 70s brought the international covenants on human rights and although they were legally binding, the states were meant to protect and promote human rights in a “progressive” way[v], that is, according to their means. It was by the end of the 70s that the declaration of Primary Health Care in Alma Ata[vi] renewed hopes and a sense of partnership for the right to health through civil society, the United Nations and countries throughout the world. However, little did it last. The oil crisis brought another dimension to the cold war, the dollar delinked with gold reserves; the Washington consensus hand in hand with the Bretton Wood institutions -created to rebuild from the wars- influenced countries to “structural adjustments” and reduce the size of the state and let the major capital powers, multinational and financial banks, to expand their businesses globally. The World Bank gradually “took over”[vii] the influence of health policies through loans subject to social spending cuts and tax exemptions to major economic powers, which from the 90s, hold most governments in their grips. Twenty years after the hopes of health for all from Alma Ata, Primary Health Care became “selective”[viii], health services became restricted to “cost-utility” (measured through the burden of disease tool of the World Bank) interventions (WB, Investing in health)[ix] and health financing was set at some meagre levels for low income countries by the commission on macroeconomics for health[x] . All were recipes of bankers for the poor countries to survive and lift from extreme poverty of under-one-dollar-a-day[xi] yet under much lower life expectancies than those feasible for all. The last decade of the century was further shadowed with the AIDS pandemic[xii] and the even less visible health impact of the collapse of the Soviet Union[xiii]. Globally life expectancy continued to slowly increase thanks to the counterbalance effect of the health gains of the most populous country in the world, China[xiv]. By the turn of the century, the Millennium declaration focused three out of their eight Millennium Development Goals on health but, not surprisingly after two decades or restricted and selective health care, they focused on either population groups (maternal and under 5 mortality) or diseases (tuberculosis, malaria and HIV/AIDS). In parallel almost on one payed attention to the upgrade of the right to health in the international covenant of economic, social and cultural rights[xv]. The Global Fund to fight those diseases, responsible for some 20% of the global burden of disease, gathered more funding than the WHO itself, whose funding became gradually tailored to those and other vertical interventions[xvi] financed by Western development agencies, the Pharma foundations and philanthro-capitalism, in close connection with the former[xvii]. The following decade claimed advances in rolling back those diseases but it soon became clear that health systems, after three decades of de-funding and brain drain, were unable to sustain the donor-funded vertical cooperation programmes. By the end of the first decade of this century the Commission on Social determinants for Health[xviii] exposed the deep connections of socioeconomic inequities and the right to health, while the Rio+20[xix] in Brazil revealed the grim horizon of climate change. However, the massive economic powers, held in fewer hands playing financial speculation globally, fuelled a global economy based on scale production and blind consumption. Countries’ and their citizens’ debts were managed by the same financial powers that ruled over the interest rates of treasury bonds, vital for all countries to keep their services running. Health was not an exception and it was progressively fragmented and privatised[xx]. The world clearly entered its second decade of the present century with growing inequalities and global warming, hijacking the future of coming generations. The cold war had changed to a torrid stage, “a war with no guns”, with far more damaging impacts[xxi]. The 2015 MDG target date arrived while the world reinvented its goals in the 2030 agenda including the objectives of equity (“leave no one behind”)[xxii] and preserving nature (most urgently limiting carbon emissions). That very year the world met in Paris and agreed on Humanity’s main challenge: rolling back climate change and avoiding the 1.5-degree/increase from preindustrial levels[xxiii], a point-of-no-return that would, and most probably will, trigger feedback loops of nature degradation and human and all-life suffering in our ill-treated planet. However, the goals of greater intra-generational (socioeconomic justice) and inter-generational (environmental justice) equity were far from ambitious[xxiv]. Equity in SDG 10 merely aimed at a greater growth (even 0.0001 %?) in the lowest 40% income group than the average (allowing for the exponential wealth capture of the 1% and the 1% of them)[xxv]. Carbon emissions in the Paris initial commitments targeted low reduction levels that would not prevent irreversible and catastrophic global warming before mid-century. The last five years saw further rupture of multilateral commitments to preserve life in our planet, including ours, with US President Trump’s denial of climate change, growing carbon emissions and global warming, loss of biodiversity and progressive stress on other planetary boundaries as surface water, forestland, sea pH, phosphorus and nitrogen cycles[xxvi]. The stress on nature and the high levels of human mobility and trade related to globalization, led to the present Covid-19 pandemic[xxvii] and revealed the dominance of the global market. The present framework shows the absence of global solidarity and frameworks to collectively share knowledge, produce and distribute global public goods[xxviii] that may equitably preserve human life and roll back this and most likely coming pandemics.
Elusive health equity
Ten years ago, the World Health Assembly welcomed the Report on social determinants and health, and countries committed to measure their levels of health inequity[xxix]. The WHO developed an online health equity monitor[xxx]. Equity became a term used widely and in all languages, even at a higher rate than equality. In the last ten years, though the use of the term seemed to decrease –see figure 1 on n-gram viewer counts screening over 8 million books -.
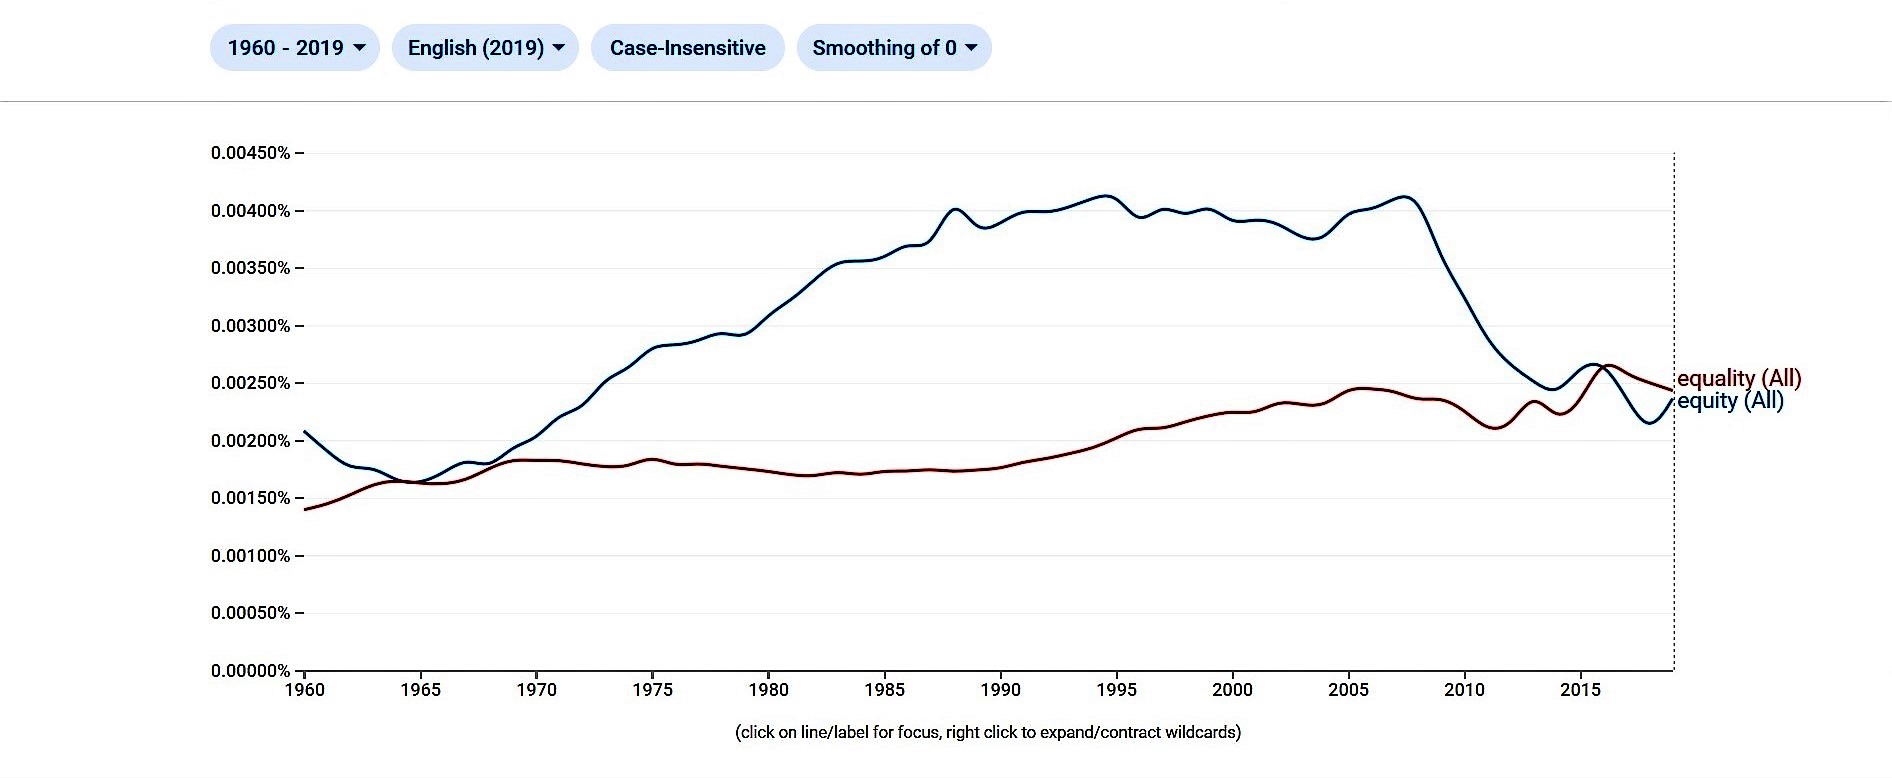
Figure 1 : N-gram viewer counts of equity vs equality
The use of the term “equity” is also subject to interpretations. Interestingly, while the Latin original word relates to fairness its use in economy has been associated to the individual shares of profits through financial speculation, one of the main dynamics leading to inequities. In health, both the WHO, most countries, civil society and academia, have measured equity through inequalities in exposure to risks, access to services or health outcomes leaving the open question of what is fair or not, to interpretation or even political visions, interests or marketing. That is how the MDGs set arbitrary targets of under-five or maternal mortality reductions, or the present SDGs opted for addressing inequalities –and in a very marginal way as above mentioned- rather than inequities. So the main question remains: what is fair and what is unfair?[xxxi]. While it is subject to cultural norms, moral references and ideologies, from the ethical point of view “a collective goal which is feasible for all can set a minimum threshold of fairness”. In health, the only internationally agreed common goal is the WHO constitution, which article 1 states that all countries will strive to “the best feasible level of health for all peoples”, that is, health equity. However, the “best feasible level of health” has not been identified and, hence, the level of health equity or inequity has never been measured. As mentioned above, the World Bank developed the metrics of burden of ill health[xxxii] and did so by comparing the effects of risk factors and diseases on premature deaths and disability with the best levels of health in terms of healthy life expectancy (enjoyed by Japan in the last two decades). However, is that “best” “feasible for all”? Certainly not in terms of the use of economic means and natural resources. This applies as well to all high-income countries and the OECD group of “developed economies” championing “development” models and “development aid”[xxxiii]. In the same line, the United Nations way of assessing progress by the “human development index” (HDI)[xxxiv] puts a significant weight on income and monetary flows (measured by GDP pc). As a consequence, it grants the highest scores to countries, which use economic means far above the world´s average (hence not replicable) and through production (even if gradually externalized), and consumption patterns incompatible with preserving natural cycles for coming generations. Had the whole world “enjoyed” the wellbeing of countries with highest HDI with their levels of carbon emissions, just to name one of the planetary boundaries under human stress, global warming would be today almost incompatible with human life. So, how can we aim at defining “best feasible level of health”?
Health equity metrics
Selection of healthy, replicable and sustainable models
Since 2011 we have been trying to define the best levels of health which are feasible today and will remain so, that is, sustainable, for coming generations. Overall, people and their forms of associations, organize their collective lives through laws, knowledge and means. While knowledge and laws aim at constant advancement and universal rights, means are limited in natural sources and economic flows, inter-related between them. We looked for healthy and feasible (and sustainable) country references. We tried to avoid the arbitrary thresholds or goals as previously set with international poverty thresholds, MDGs, SDGs and others. We then chose health, economic and ecological indicators available at national averages since 1960 from World Bank, UN and WHO sources. To select “healthy” models we chose those with constant levels of life expectancy above world average. Among them, we looked for those constantly using economic means in a globally replicable way, measured in GDP pc below world average. Within that group, we identified countries with carbon emissions pc below the “ethical threshold” which would lead to 2 degrees of global warming during the XXIst century. The analysis then found 14 countries which met the above-mentioned three criteria (Healthy, economically Replicable, ecologically Sustainable: HRS)[xxxv] constantly from 1960 to 2010 : Albania, Armenia, Belize, Colombia, Costa Rica, Cuba, Grenada, Saint Lucia, Saint Vincent, Georgia, Paraguay, Sri Lanka, Tonga and Vietnam. Five years later, we refined our selection of healthy references introducing sex disaggregation in life expectancy and the burden of disability through the healthy life expectancy indicator. To select economically replicable models we looked not just at GDP pc but also GNI pc and not only in constant value but also in purchasing power parity (PPP). By that time, the International Panel on Climate Change (IPCC) updated the threshold of global warming “point of no return” at 1.5 degrees over pre-industrial levels, and so we adjusted the “ethical threshold”. As a result, our selection of “HRS” countries in 2016 ruled out half of the 2011 HRS models, remaining only seven countries, which met the updated HRS criteria: Armenia, Colombia, Costa Rica, Paraguay, Sri- Lanka and Tonga[xxxvi]. Most of the countries dropped off the previous list did so due to carbon emissions above the ethical threshold. In our latest analysis hereby presented, we again looked at constant HRS models introducing three new indicators: wealth pc in economic replicable models (R), bio capacity pc, and ecological footprint consumption pc below world’s bio capacity average selecting ecologically sustainable (S) models beyond the carbon emissions. The trend of the previous list of countries (trespassing the carbon emission threshold in most cases and in others, as Costa Rica, the GDP pc) led to the selection of only one HRS country. In fact, that only HRS country 1960-2020 was also the only one to meet all criteria, including the latest introduced on bio capacity and ecological footprint, during the last 2010-2020 decade. That country is Sri Lanka.
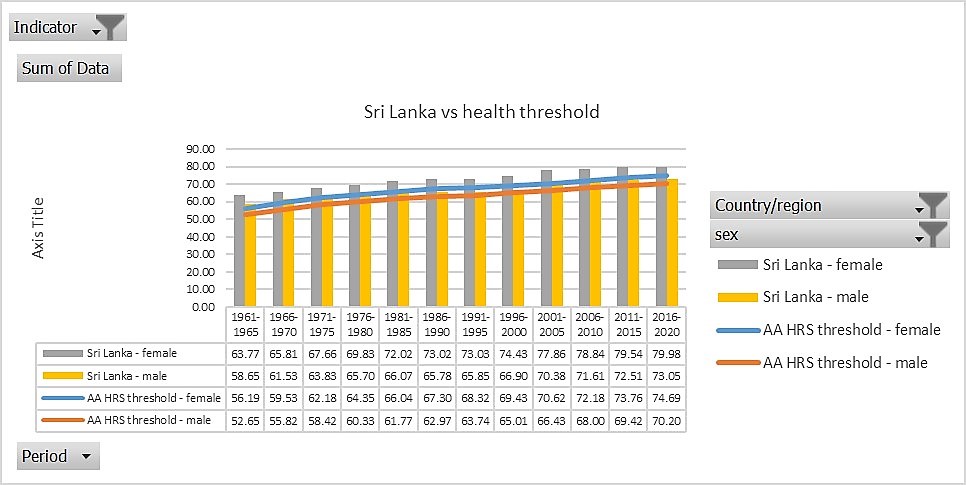
Figure 2 : Sri Lanka life expectancies vs thresholds (world averages)
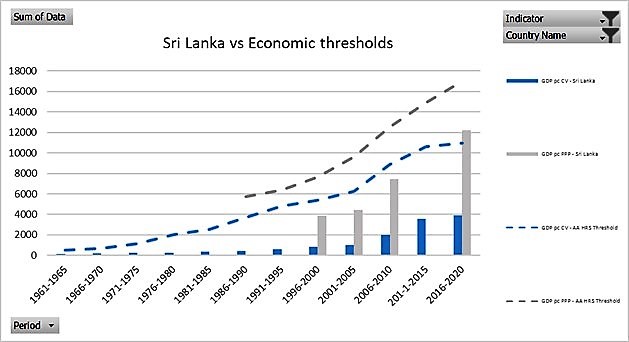
Figure 3: Sri Lanka GDP and GNI pc (CV and PPP) vs. thresholds (world averages)
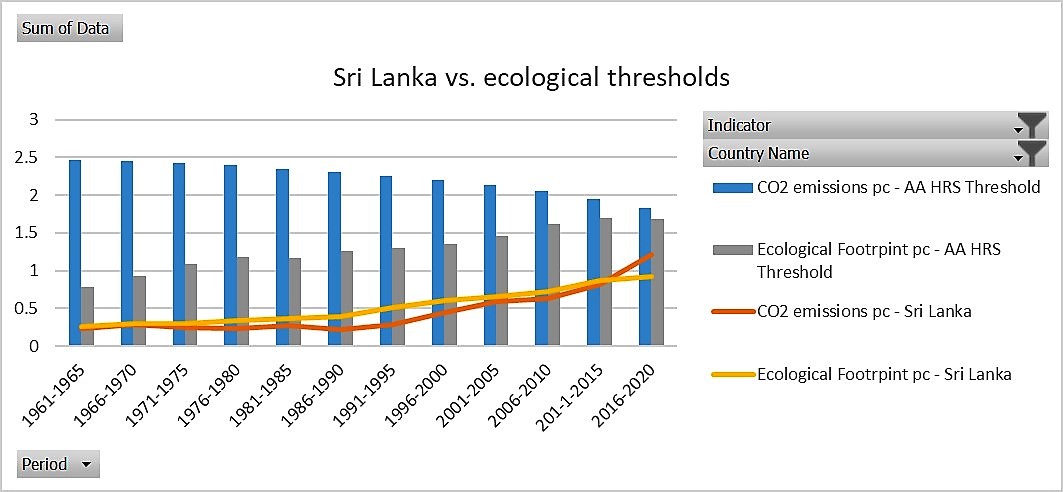
Figure 4 : Sri Lanka carbon emissions and ecological footprint pc vs. thresholds (world bio capacity pc average)
Obviously international data have many limitations: the reliability of those statistics varies widely between countries and the average does not reflect the subnational often-heterogeneous reality, especially in large countries. We looked at subnational data -where available- and identified subnational regions, which met HRS criteria. Data are more limited across countries and time- periods on health and economic indicators. We found no official data on carbon emissions pc at subnational levels and we used the international correlation between GDP pc and carbon emissions. Using only those three indicators and often only available for less than a decade, we found large subnational regions in China (Shanxi, Guangxi, Anhui, Sichuan and Henan), India (Kerala), Russia (Ingushetia and Chechnya) and Brazil (Alagoas, Praiba, Ceara, Para, Bahia and Rio Grande). None of the EU, USA and Japanese subnational regions were ecologically sustainable. Ideally, the analysis of HRS indicators at subnational and sub-regional levels would increase the sensitivity in finding more HRS populations with healthier, more economically efficient, and ecologically sustainable features.
The burden of health inequity
Following the ethical argument of equity stated above (feasible common goal = moral imperative) in coherence with the WHO foundational objective (best feasible health for all) and the identification of such feasible and sustainable health models (for now at national level), we could calculate the burden of health inequity, that is, the unfair and preventable (in relation to feasible and sustainable models) loss of human life. The HRS models served as the reference mortality rates and so we could estimate the expected mortality in all countries if they enjoyed such –feasible and sustainable- rates (adjusted mortality rates). The net burden of health inequity excess of observed mortality in relation with the HRS-expected on. As the UN Population Division publishes data on population and deaths by country, sex, age (5-year age groups) and country as 5-year annual averages, we have been estimating the burden of health inequity for the last decade for the periods 1960-2010, 1960-2015[xxxvii] and –hereby- 1960-2020. Using the first set of HRS –simplified- criteria (3 by 50 years and 198 countries : some 30,000 data) and 14 HRS reference countries till 2010 and the population and mortality data by 5-year periods and country/sex/age groups (some 80,000 data), the annual net burden of health inequity (nBHiE) evolved from some 23 million in 1960 to some 16 million in 1970 and was stable thereafter at that level –with some increase in the 90s (due to the AIDS pandemic and the collapse of the Soviet Union)- till 2010[xxxviii]. When we applied updated and refined HRS reference data in 2015 we found similar results with slightly lower nBHiE in the 60s and higher (around annual 17 million) in the last decade. At that point, we looked at sub-regional (European Union) and sub-national (China, India, USA, Russia and Brazil) data to identify –as mentioned above- HRS states and provinces, even counties in some cases, and estimate national nBHiE. When applying lower level/size and larger sample units in the analysis, we found enhanced sensitivity in detecting nBHiE in the regions and countries with life expectancy above world average. For instance, with the caveat that no NUTS region in the EU were ecologically sustainable, the ratio of nBHiE ref global HRS vs. nBHiE ref. sub-regional HR(S) was > 0.11. In the analysis of the data adjusted to refined HRS criteria and references (Sri Lanka) and updated until 2020, the nBHiE in the last five years remained at some annual 16 million. Figure 5 shows the different estimates of the nBHiE by the evolving HRS criteria and updates by the 5-year period UN Population data. The divergence of the most recent HRS methodology in the 1996-2000 period relates to the peak of victims of the Sri Lanka war, which in total meant some 100,000 casualties, mainly adult men. Hence, the under-estimate of the global burden of health inequity by the end of the century compared with the previous methodologies and results where a larger group of countries diluted individual circumstances in each of them.
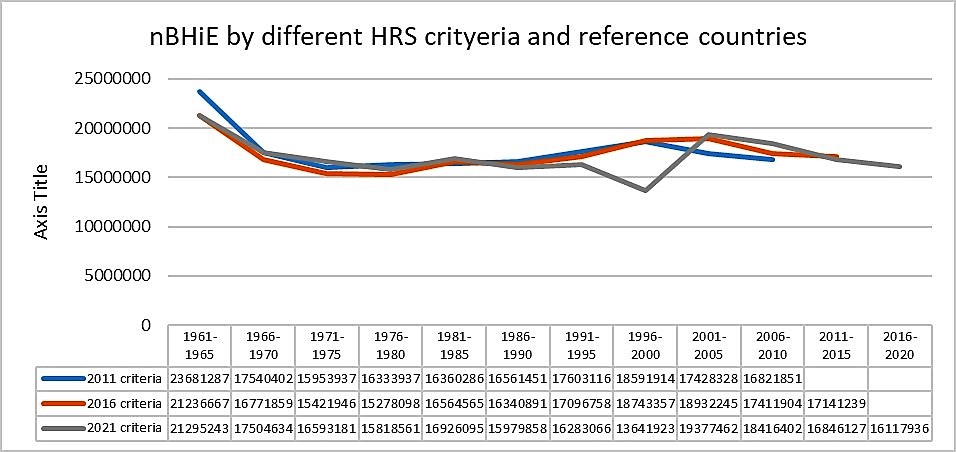
Figure 5: nBHiE by the evolving HRS criteria and country references
As population size and demographic structure conditions the nBHiE and disables its comparison between countries, periods of time sex and age groups, we estimated the proportion of deaths, which were due to health inequity by dividing the nBHiE by the total number of deaths. We called it the relative burden of health inequity (rBHiE). As Figure 6 shows, such proportion of unfair/preventable deaths has decreased slightly in the last 5 years but remains close to one third of all deaths, a level with only minor variations since the 70s. The rBHiE is higher in women than men and such gap has increased since the turn of the century.
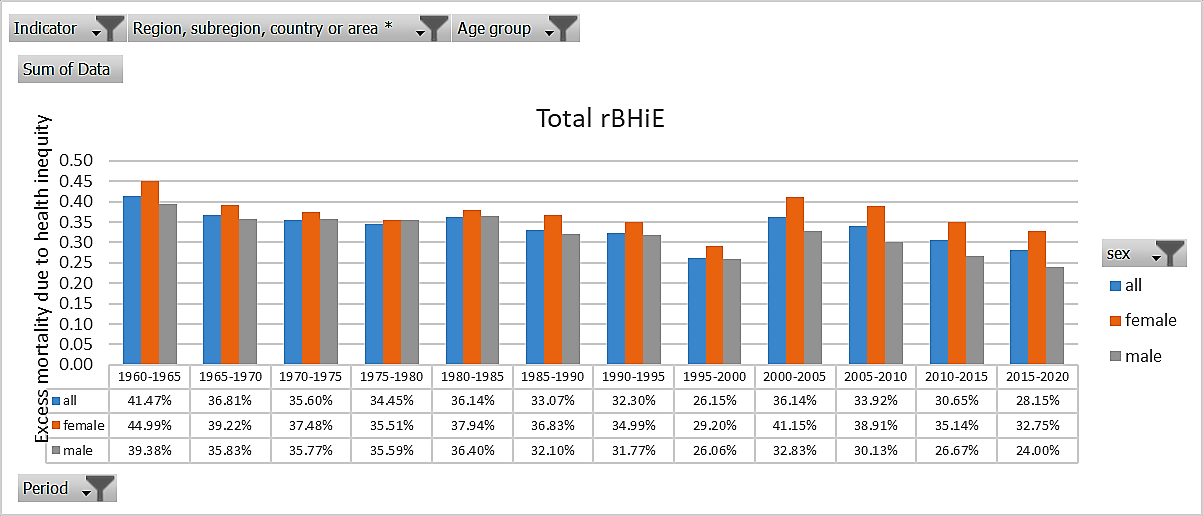
Figure 6 : World's rBHiE 1960-2020
We applied the same analysis to age groups and found, as Figure 7 shows, that the relative burden was higher in younger age groups and women had their higher share of inequity than men in the reproductive age groups.
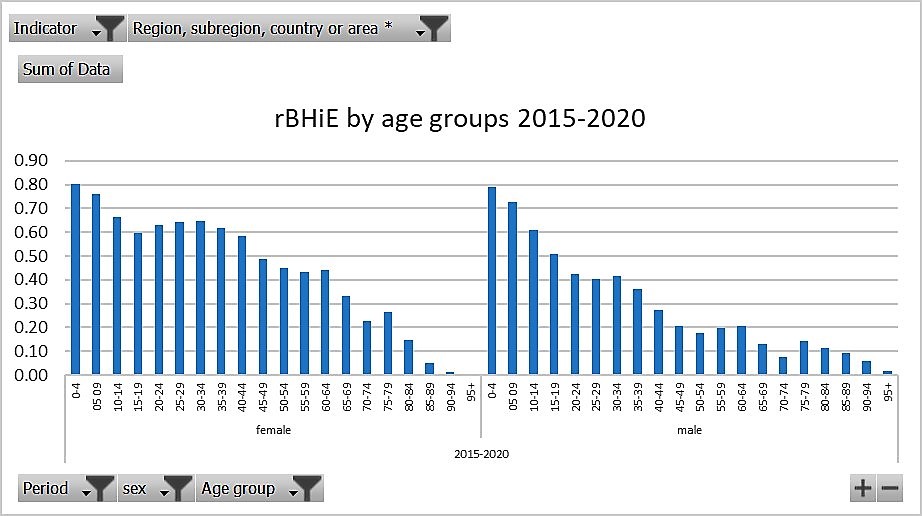
Figure 7: World's rBHiE 1960-2020 by sex and age groups
The former analysis emerges from interactive pivot tables and maps of all countries and main geographic and economic regions based on algorithms calculating nBHiE and rBHiE data by 5-year period (1960-2020), sex, 5-year age groups. They form a set of close to 500,000 data which will be shortly on line and interactive to search and compare the burden of health inequity across countries, time and demographic variables.
Health and economic inequity
Another dimension of our analysis is the link between the burden of health inequity and the unfair distribution of economic inequality (“equinomics”). By the very concept and methodology of the selection of HRS models, those countries with lower levels than the HRS GDP pc have a lower life expectancy and the highest burden of health inequity. We therefore called the HRS GDP/GNI pc (CV or PPP) the “dignity threshold”. In contrast with the poverty threshold set by the World Bank (at present daily $1.9 pc) the dignity threshold enabling feasible and sustainable life expectancy stands now at daily $10.8 pc, 5.7 times higher. We then looked at the level of GDP pc above which no country has had -along the study period- levels of sustainable ecological indicators (carbon emissions and ecological footprint), which was almost symmetrical with the dignity threshold above the world average GDP pc and we called “excess threshold”. Interestingly, just four countries of over one million inhabitants (Japan, Switzerland, Italy and Spain) had life expectancy above Greece, with GDP pc below the mentioned excess threshold. Moreover, when exploring the sub-national regions’ life expectancies we found regions in Greece, Cyprus, Italy and Spain, with GDP pc lower than the excess threshold and life expectancies higher than the country with highest levels (Japan), notably Ipeiros, in Greece (GDP pc 14,600, life expectancy 84 years). Hence, GDP pc above the mentioned excess threshold of some daily $50 pc is not required for better health. In fact, most countries with higher GDP pc have lower life expectancies than Greece and the mentioned regions. Furthermore, higher levels of GDP pc accumulates resources in detriment of the deficit areas disabled to the right to health, and is unsustainable with the sustainability of natural resources, hence the health of coming generations.
The dignity and the excess thresholds above described set three “equity zones”: deficit, equity and excess. The majority (84%) of the nBHiE takes place in countries in the deficit zone, home –see below- to almost half of the world’s population. Countries with average GDP pc higher than the HRS reference have a degree of burden of health inequity revealing health inefficiencies or internal inequities in comparison with the HRS standard. Three fourths of the nBHiE in the equity zone takes place in China, Russia, South Africa, Brazil and Mexico.
Figures 8 and 9 show the contrast of the distribution of the world’s population and GDP according to the deficit, equity and excess zones. While only some 15% of the world’s population lives in countries in the excess zone, they accumulate almost 70% of the GDP. We also looked at wealth and the distribution was even more skewed, with the excess 15% population owning over 80% of the world’s estate, goods and capital.
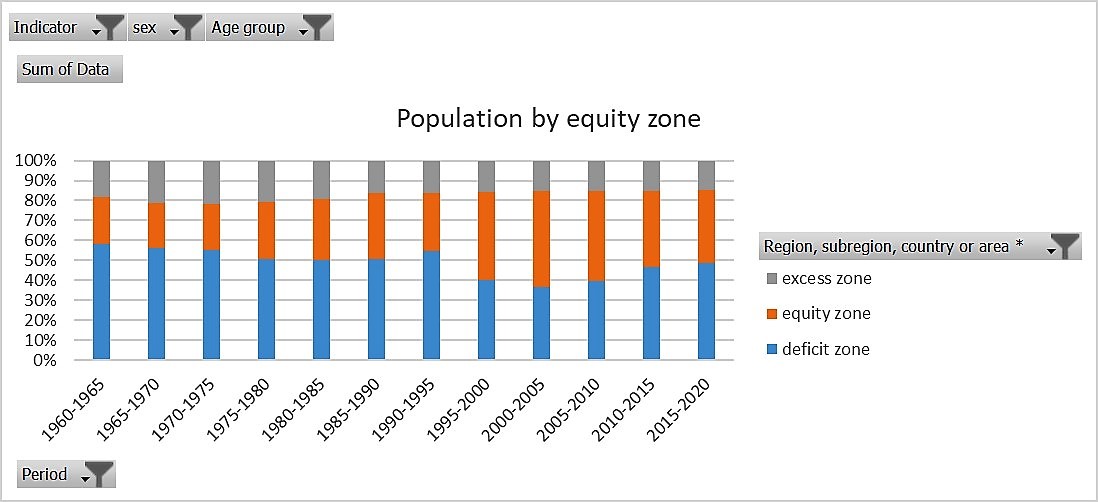
Figure 8: World population by countries' equity zones
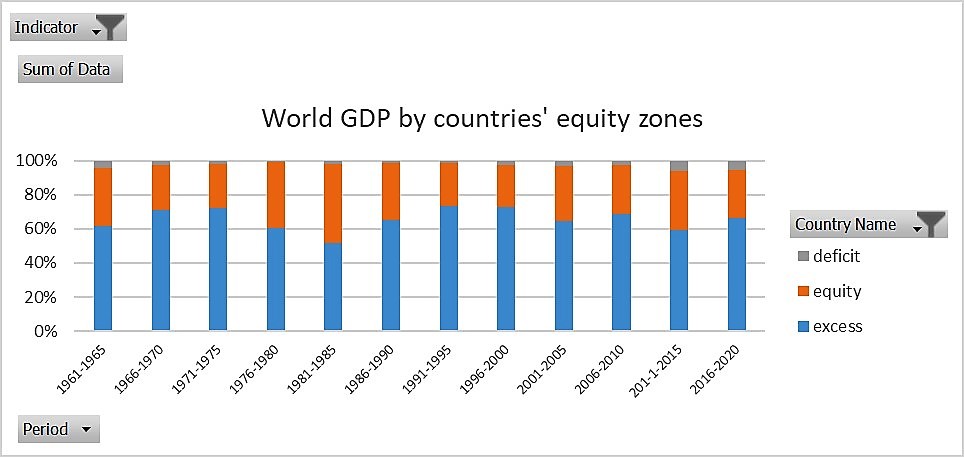
Figure 9: World GDP by countries' equity zones
The redistribution required to enable the entire world’s population to have at least the dignity threshold’s spending capacity would be 7.75% of the world’s GDP (vs. the OECD DAC 0.7% commitment) which is just 10.6% of the excess GDP (unnecessarily) above the excess threshold.
Health inequity and the ecology
The world’s national borders already pose a major inequity in terms of access to natural resources. Figure 10 shows how in fact the countries with lower access to economic flows (GDP pc), in the deficit zone, also have a low bio capacity pc. We are, therefore, born already with skewed opportunities to enjoy the universal right to health.
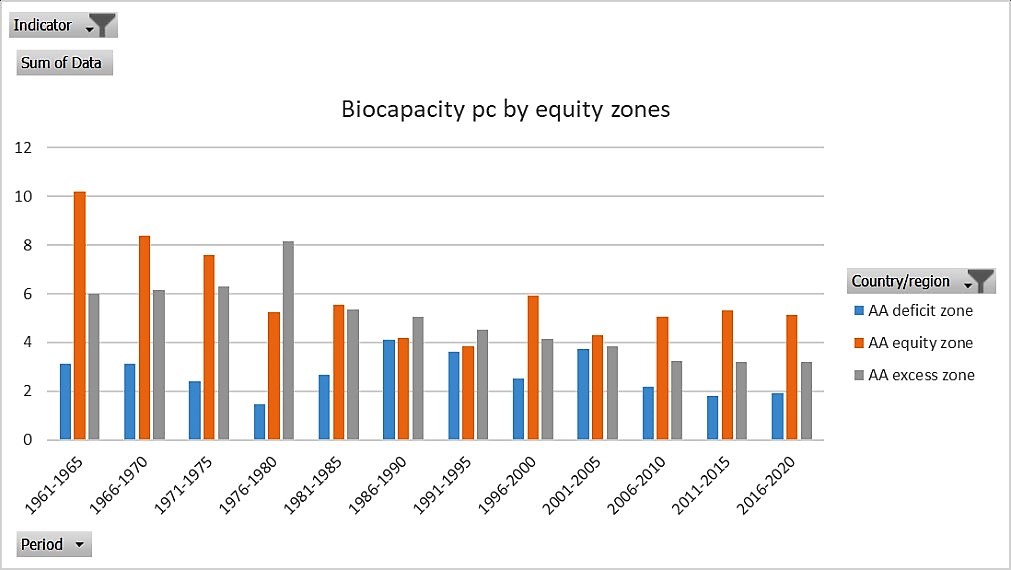
Figure 10 : Bio capacity pc by populations in countries' equity zones
As figures 11 and 12 show, all countries in the excess zone have ecological footprint and carbon emissions pc, which are, if generalized, unsustainable with the turnover of natural resources. Even in the equity zone, the average of ecological footprint pc surpassed the ethical threshold in the last decade while the one for carbon emissions did so already in the 90s. In the case of carbon emissions, the level of cumulative carbon emissions pc of excess zone countries, from the industrial revolution until present days, would have already meant over 5 degrees of global warming and render unliveable most of the world, especially the tropical zones colonized by those polluting powers and decimated from their natural resources.

Figure 11: Ecological footprint by equity zones vs. ethical threshold
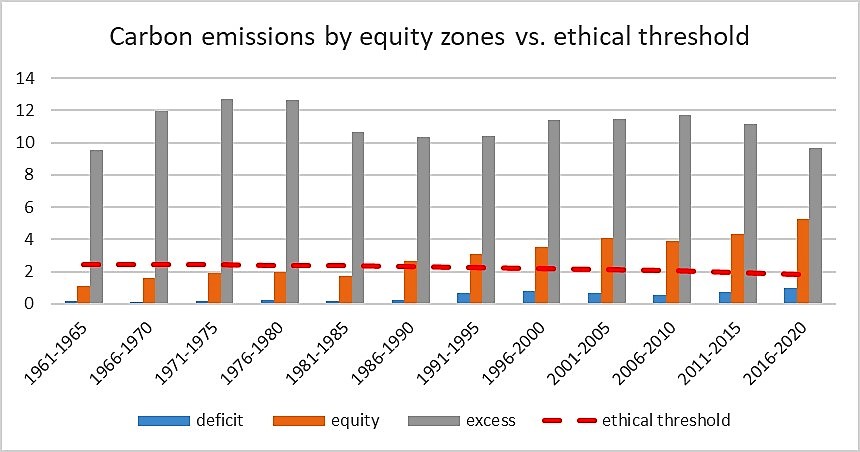
Figure 12: Average carbon emissions by countries' equity zones vs. ethical threshold
According to our analysis, the present level and trend of carbon emissions will lead to the 1.5-degree warming above pre-industrial levels before 2050. If that trend prevails, increased temperatures will mean an excess mortality of 220 million. The distribution of such excess mortality, more than three times the suffering by the world wars in the XXth century reveals the most perverse inequity : it will take place mainly in the second half of the century, in those over 60 years of age (millennials born after 1990) and in the less polluting countries in tropical regions.
HDI vs. Health holistic index
When we measure development indicators, we look at individual wellbeing, based on the western philosophy, which grants to each human life the highest value and so has championed universal human rights, including the right to health. As we have seen in the analysis of the burden of health inequity of the last 60 years, large inequities in natural and economic resources result in high levels of burden of health inequity within pour generation and between ours and the coming generation (due to global warming). We therefore looked into the negative impact on others of excess accumulation of resources (preventing equitable distribution and maintaining half the world in the deficit zone incompatible with the right to health) and of excess carbon emissions (leading to growing excess mortality in the coming generations). We estimated the life years lost due to the burden of health inequity in countries in the deficit zone (with unmet basic condition of the dignity threshold of resources). We then calculated the excess GDP above the excess threshold (above which health and wellbeing does not improve). The relation between both resulted in around one week life lost per annual GDP pc 1000$ above the excess threshold. We did a similar analysis for the life years to be lost due to global warming and the relation with excess carbon emissions above the ethical threshold. The result was of two life days lost per annual excess CO2 ton above the ethical threshold. We deducted from the individual life expectancy at birth in each country the annual negative impacts of excess GDP pc and excess carbon emissions pc, to calculate what we call “equitable and sustainable wellbeing” (ESW) (including individual wellbeing void of negative impact on others).
The countries with highest ESW were Costa Rica (the highest, with 77.7 years) followed by Cuba, Greece, Albania and Uruguay. None of them is fully economically replicable and/or ecologically sustainable but falls within the equity curve and has committed to reduce carbon emissions below the ethical threshold. We compared our assessment with the UN Human Development Index (HDI). The HDI grants, besides life expectancy and education years (which correlates with the former), high value to GDP pc with no limit (and calls it “a decent standard of living”), mimicking the dominating concept and dynamics of capitalism (constant growth and accumulation). Consequently the countries with highest ESW rank moderate in the HDI rank while those with the highest HDI rank among the lowest in the ESW due to their negative impact through excess GDP pc and excess carbon emissions.
| Country | HLI 2018 | HLI rank | HDI 2018 | HDI rank |
| Costa Rica | 77.72 | 1 | 0.81 | 62 |
| Cuba | 76.83 | 2 | 0.78 | 70 |
| Greece | 76.29 | 3 | 0.89 | 32 |
| Albania | 76.12 | 4 | 0.80 | 69 |
| Uruguay | 75.94 | 5 | 0.82 | 55 |
| Chile | 75.94 | 6 | 0.85 | 43 |
| Panama | 75.69 | 7 | 0.82 | 57 |
| Lebanon | 75.41 | 8 | 0.74 | 92 |
| Croatia | 74.95 | 9 | 0.85 | 43 |
| Montenegro | 74.81 | 10 | 0.83 | 48 |
Table 1: Top countries in Equitable and Sustainable Wellbeing (ESW) vs. HDI and rank
| Country | HLI 2018 | HLI rank | HDI 2018 | HDI rank |
| Norway | -1.30 | 183 | 0.96 | 1 |
| Ireland | 3.43 | 182 | 0.96 | 2 |
| Switzerland | -7.24 | 184 | 0.96 | 2 |
| Hong Kong | 40.29 | 167 | 0.95 | 4 |
| Iceland | 8.47 | 180 | 0.95 | 4 |
| Germany | 39.75 | 169 | 0.95 | 6 |
| Sweden | 31.69 | 175 | 0.95 | 7 |
| Netherlands | 33.59 | 174 | 0.94 | 8 |
| Australia | 25.44 | 176 | 0.94 | 8 |
| Denmark | 23.17 | 177 | 0.94 | 10 |
Table 2 : Top countries in Human development Index vs. ESW value and rank
Conclusions
Our analysis of global health equity has been challenging for a decade the prevailing concepts of development, poverty threshold and health equity, and their related metrics.
With the preliminary findings of our third analysis hereby outlined, we have fine-tuned criteria of wellbeing-health, economic feasibility-replicability and ecologic sustainability and updated to the period 1960-2020 demographic data. The results, in the midst of the Covid-19 pandemic, adding more global inequity[xxxix], lead us to reaffirm our challenge to the above-mentioned mainstream concepts, in our opinion, detrimental to the universal right to health and health equity.
The main findings from the latest global analysis of health equity are as follows:
1.-the concept of equity, that is, fair inequality, requires the definition of feasible levels of the agreed common goal (health). The 73-year old (same as world average life expectancy now) constitution of the World Health Organization states this concept (best feasible levels for all) in its founding constitution. While best health levels are identified to estimate the burden of ill health and economic indicators as cost-utility, often guiding major decisions on priorities and strategies, best feasible (and sustainable) levels have not been identified and used at national nor international levels. WHO continues to monitor health equity, ten years after the resolution on social determinants for health, by estimating health inequalities (by stratifying variables of income, education or rural/urban settings) and only in certain age groups (children and pregnant women) and some countries, (low and some middle income countries) based on household surveys with limited representability and time-frequency. Through our studies during the last decade, we continue to propose the definition of best feasible (and sustainable) health levels which enables the estimates of net and relative burden of health inequity. We propose this methodology, improved and developed at national and subnational levels, as a critical indicator of the realization of the universal right to health and a powerful barometer of international and national justice.
2.-the number of countries meeting the evolving (fine-tuned with health sex disaggregation, economic and ecologic dimensions) criteria of replicable and sustainable health-wellbeing from 1960 has been decreasing from fourteen till 2010, to seven till 2015 and only one till 2020, possibly the last year when we may identify countries that have steadily met the mentioned criteria.
- – for the last forty years, the net-burden of health inequity (nBHiE) has been fluctuating between 18 and 16 million deaths and the relative burden of health inequity (rBHiE) remained almost stagnant around 30% with a slight reduction since the turn of the century. Such reduction rate has been lower for girls and women and they suffer significantly higher levels health inequity, especially in the reproductive age groups. Children and youth have higher rBHiE although older age groups have gradually increased their rBHiE with time. Our interactive database (updated with the recent data hereby outlined) allows the comparison of the net and relative burden of inequity between periods, countries, sex and age groups. When such analysis is done at subnational level, as we have attempted in the last years in a number of countries, the mapping of the burden of health inequity and demographic features may guide economic, social, fiscal and territorial cohesion/equity targets and strategies.
4.-the HRS reference models define a “dignity threshold” below which no country has, now for sixty years, been able to enjoy a level of life expectancy at birth, for women and men, feasible and sustainable for all. Such dignity threshold, presently at some 10$/day, is more than five times higher the “poverty threshold”. One third of the world’s population lives between the poverty and the dignity threshold, has no chance to enjoy the right to health and remains neglected by economic and cooperation approaches led by the concept and threshold of poverty.
- – The prevailing development concepts and references are deeply intertwined with the mainstream economic dynamics ruling the international and national policies and lifestyles. It avoids setting any limit to economic flows, growth and accumulation. In fact, it grants the highest human development index to the countries with highest GDP pc called (the higher the better) “decent (?) standard of living” which, if generalized, would require several planets in terms of natural resources to be replicable and sustainable. Contrary to this dominant paradigm, excess accumulation of economic flows and wealth is one of the main root causes of health inequity as it prevents equitable distribution of resources while it is ecologically unsustainable and, above the excess threshold, does not improve individual and collective health. We therefore propose an equitable and sustainable wellbeing index, which takes into account the individual conditions counterbalanced with the negative impact on others through excess accumulation and nature degradation. The countries with highest HDI rankings are among the lowest in the ESW index and this fact merits a debate around the concepts and metrics guiding development.
6.-We define the “equity curve” as the distribution of the human population according to their GDP pc capacity, between the above-mentioned dignity threshold a centre around the average and a symmetric “excess threshold”. It allows best subnational levels of life expectancy within the equity curve, economically replicable models to gradually improve its efficiency in translating shared knowledge and resources into wellbeing and a sustainable use and recycling of natural resources to allow intergenerational health equity.
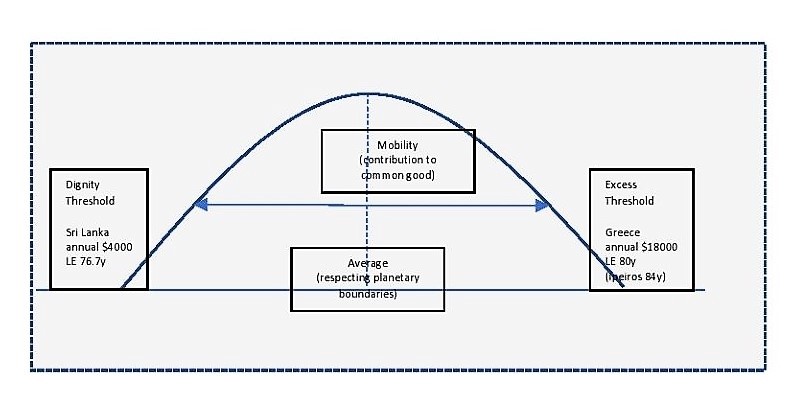
Figure 13: Equity curve and thresholds
Acronyms
HRS : healthy replicable and sustainable
BHiE : Burden of health inequity
nBHiE : net burden of health inequity
rBHiE : Relative burden of health inequity
WES : Wellbeing in equity and sustainability
References
[i] https://www.ncbi.nlm.nih.gov/books/NBK316260/
[ii] https://www.scielo.sa.cr/scielo.php?script=sci_arttext&pid=S1409-14292013000200003
[iii] https://www.un.org/en/about-us/universal-declaration-of-human-rights
[iv] https://www.who.int/governance/eb/who_constitution_en.pdf
[v] https://www.ncbi.nlm.nih.gov/pmc/articles/PMC5394996/
[vi] https://www.who.int/publications/almaata_declaration_en.pdf
[vii] https://www.ncbi.nlm.nih.gov/pmc/articles/PMC1449852/
[viii] https://pubmed.ncbi.nlm.nih.gov/114830/
[ix] https://pubmed.ncbi.nlm.nih.gov/10619685/
[x] https://www.ncbi.nlm.nih.gov/pmc/articles/PMC2567724/
[xi] https://www.researchgate.net/publication/46511466_Dollar_a_Day_Revisited
[xii] https://pubmed.ncbi.nlm.nih.gov/9677187/
[xiii] https://www.ncbi.nlm.nih.gov/pmc/articles/PMC1116380/
[xiv] https://bmcpublichealth.biomedcentral.com/articles/10.1186/s12889-018-5112-7
[xv] https://www.ncbi.nlm.nih.gov/pmc/articles/PMC5394996/
[xvi]https://www.researchgate.net/publication/228449096_Vertical_funds_in_the_health_sector_Lessons_for_education_from_the_Global_Fund_and_GAVI
[xvii] https://journals.openedition.org/faceaface/745
[xviii] https://www.who.int/social_determinants/thecommission/finalreport/about_csdh/en/
[xix] https://sustainabledevelopment.un.org/rio20
[xx] https://www.ncbi.nlm.nih.gov/pmc/articles/PMC3052329/
[xxi] http://www.peah.it/2018/07/5498/
[xxii] https://unsdg.un.org/2030-agenda/universal-values/leave-no-one-behind
[xxiii] https://www.ipcc.ch/sr15/
[xxiv] https://scitechdaily.com/the-truth-behind-the-paris-agreement-climate-pledges-insufficient-to-address-climate-change/
[xxv] https://www.cesr.org/disparity-dignity-inequality-and-sdgs
[xxvi] https://www.stockholmresilience.org/research/planetary-boundaries.html
[xxvii] https://ideas4development.org/en/pandemics-environmental-origins-covid-19/
[xxviii] https://www.who.int/bulletin/volumes/81/7/en/Smith0703.pdf
[xxix] https://www.who.int/social_determinants/implementation/en/
[xxx] https://www.who.int/data/gho/health-equity
[xxxi] https://pubmed.ncbi.nlm.nih.gov/16533114/
[xxxii] https://olc.worldbank.org/content/global-burden-disease
[xxxiii] https://www.oecd.org/dac/thedevelopmentassistancecommitteesmandate.htm
[xxxiv] http://hdr.undp.org/en/content/human-development-index-hdi
[xxxv] https://www.sciencedirect.com/science/article/pii/S0033350617301610
[xxxvi] https://oxfordre.com/publichealth/view/10.1093/acrefore/9780190632366.001.0001/acrefore-9780190632366-e-62?rskey=mI3ffX&result=2
[xxxvii] https://www.dodax.fr/fr-fr/livres-et-livres-audio/medecine-generale/d-chiriboga-n-kelley-jm-ramos-reviewers-the-ethics-of-health-equity-global-burden-of-health-inequity-trend-from-1950-and-prospects-in-the-xxist-century-dp4HG0BMF3L35/
[xxxviii] https://www.binasss.sa.cr/eng.pdf
[xxxix] https://www.thelancet.com/journals/lancet/article/PIIS0140-6736(20)31145-4/fulltext